
Real gross domestic product (GDP) growth in the US was up 3.8% for the second quarter, a strong rebound from the negative 0.6% in the first quarter.[1] This was driven by a 29.3% decline in imports (following a 38% surge in Q1) and resilient consumer spending (which makes up 68% of GDP). The strength of imports in Q1 and consumer spending in Q2 may have been reactions to proposed tariff policy and front-loading imports and purchases to stay ahead of price increases. The positive GDP growth, consumer spending patterns and capital expenditure cycle associated with cloud data centers and artificial intelligence (AI) have spawned positive earnings reports and guidance for the remainder of 2025 and into 2026.
The Federal Reserve, while not focused on stock market returns, operates from a mandate to promote stable prices and maximum employment. The Fed’s preferred methods of measuring inflation are the Personal Consumption Expenditure (PCE) index and Core PCE index (which excludes food and energy). The Fed has a target long-run inflation rate of 2 percent. Through August, the PCE index increased 2.7% and core PCE increased 2.9% from the prior year. The Federal Open Market Committee (FOMC) median member forecast projected Core PCE for 2025 to be 3.1%, and 2.6% in 2026 at their September 17 meeting.[2] Moderate inflation in the US is surprising, considering the tariff policy. Effective tariff rates in the US average 19.7% after accounting for substitutions, shifting import patterns and purchasing behaviors.[3] Pulling purchases forward from the third quarter may have helped GDP growth, with some stockpiling among consumers to avoid rising prices and potential supply chain disruptions. This could mean slower third- and fourth-quarter GDP growth results.
With inflation moderating, the FOMC has turned more attention to the labor markets. Unlike typical labor market slowdowns, fewer payroll gains haven’t led to a spike in the unemployment rate (August 2025 4.3% vs August 2024 4.2%). The current pullback is primarily attributed to three interconnected trends: a significant decline in immigration, the growing impact of AI implementation, and the normalization of government job growth. Critically, the growth rate of the foreign-born labor force has weakened considerably. Recent data from the Pew Foundation showed that the foreign-born population and labor force both declined sharply in the first half of 2025, marking the first such dip since the 1960s and directly limiting the pool of available workers.[4]
The decline in labor supply, especially from lower immigration, mechanically lowers the unemployment rate as well as the economy’s potential growth rate and has been cited by economists as a factor that could trim US growth in the coming years.[5] The median unemployment rate projections have risen to 4.5% for 2025 and 4.4% in 2026.[6] The rate has been slowly rising from lows in the 3.5% range in 2022 and 2023. Balancing the moderating economic growth and slowing job gains, rising but relatively low unemployment and modestly elevated inflation rates gave the Federal Reserve enough evidence to lower the federal funds rate by ¼ point to the range of 4% to 4.25% at the September FOMC meeting.
At its October meeting, the FOMC made a similar determination that risk to unemployment was higher than inflation risk, and so cut rates an additional ¼ point, to the range of 3.75% to 4 percent. They also announced they would conclude the reduction of aggregate securities holdings (“quantitative tightening”), effective December 1. These actions should be stimulative to economic growth. The committee will be attentive to economic data in making any further cuts this year and next.
The next meeting will be in December, when the FOMC policy committee will have to contend with the ramifications of a US government shutdown that began on October 1 and ended November 12. With the government shut down for 43 days, not only are the normal reporting schedules delayed, but in some cases the collection of that data goes undocumented. The typical metrics may not be available for the FOMC to consider in making decisions in December.
The September projections by the Federal Reserve Board indicate more rate cuts on the horizon, perhaps not in December, but in 2026. Citing “strongly differing views” on the FOMC, Fed Chair Jerome Powell indicated future rate cuts are not guaranteed and a pause is possible, further stating that a December cut is “far from” a foregone conclusion.[7] Rate cuts should help stimulate corporate borrowing and by extension, encourage hiring to prop up the softening labor market. While this year’s two rate cuts to date were welcomed (and expected) by the markets, the consensus among investors is that the federal funds rate is still too high. The FOMC has a longer-run median target in the range of 3%, indicating a potential 75 basis points of additional cuts if inflation and employment statistics line up.
Resilient YTD Performance
The US stock market has been remarkably resilient in 2025, largely ignoring the geopolitical tensions and actions around the globe, Trump tariff implementation, labor market slowdown, and high market valuations. The S&P 500 Index gained a total return of 14.8% year-to-date through September. All eleven market sectors have positive returns over this period. On a price return basis, Communication Services took the top spot among sectors, posting 23.7%, followed closely by the Information Technology sector with 21.75 percent. Returns in both sectors were driven in large part by the current AI investment cycle. Industrials returned 17.1%, Utilities 15.1%, and Financials 11.5%, also benefiting from the capital expenditure cycle. Trailing these double-digit returns year-to-date, Materials returned 7.7%, Consumer Discretionary 4.7%, Energy 4.3%, Real Estate 3.5%, Consumer Staples 2% and Health Care 1.2 percent.[8] The most defensive stock sectors are barely generating positive gains in this market, but they provide ballast for stability in portfolios when the market turns volatile.
On an equal weighted basis, the market has returned 9.9%, indicating more broad-based participation beyond the narrow Magnificent Seven and AI trades. Large-cap stocks continue to dominate returns in the US. S&P mid-cap and small-cap indexes have returned 4.6% and 2.9%, respectively. Perhaps resulting from a perceived flight to quality and a weakening US dollar, gold has returned 46.6% YTD, pushing through $4,000 an ounce. Price returns for international market indexes have been strong this year in US dollar terms, beginning from a cheaper valuation relative to the US. The MSCI EAFE developed-market index is up 22.3% YTD and the MSCI Emerging Markets is up 25.2 percent. The last time international developed and emerging markets outperformed US large-cap indexes in an up market was in 2017.
Are Market Valuations High?
We have been in a bull market since the end of the 2022 market decline of -18.1 percent. The YTD return for the S&P 500 index is tracking a little behind the returns of the past two years (2023: +26.3%; 2024: +25.0%), but right in line with the 16-year average market gain of 14.94% per year since 2009—the end of the “Great Recession.” This is an extraordinary run of outperformance relative to a 40-year average of 9.83% through 2024. Since the 2022 market bottom on October 12, the S&P 500 has returned 87% on a price basis.
The 12-month forward price/earnings ratio for the S&P 500 was 21.93 on September 30. This measure indicates the market price of the index at $6,688.46 is worth $21.93 for every dollar of the forecasted next twelve months of earnings. This metric is often stated as 21.93 times earnings, a way to compare the value of stock investments with disparate prices, and relative history as earnings grow through time. Over the past thirty years, this forward P/E ratio has averaged 16.76 times earnings. It is currently trading at a 30.8% premium to the historical average. Like any metric based on expectations of future earnings, the ratio is only as good as the forecast.
Being a market capitalization weighted index, the S&P 500’s top 10 holdings are dominated by Magnificent Seven names and most of the technology, communications and AI chip stocks driving the stock market the past few years. Collectively, the top 10 holdings account for 38% of the index, and they also happen to make up most (9 of 11 stocks) of the small club of the trillion-dollar-plus market cap companies in the world. The only omissions from this club are Saudi Aramco (a Saudi Arabian energy company) and Taiwan Semiconductor (the world’s largest chip manufacturer), which are not a part of the index. We mention this only to highlight that the P/E ratio of the index is skewing higher than normal due to the outsized growth rate of the earnings of the largest companies in the index driving up their valuations. On an equal-weighted basis, the S&P 500 index forward P/E ratio is more reasonable at 17.1 times earnings, very near the 20-year average of 16.4. Nevertheless, the forward P/E ratio is near historical highs, prompting many to conclude that the market is expensive relative to history.
Another way to determine whether a market is over- or under-valued is to look at the Shiller ratio. To try to correct for abnormal economic periods, Yale economics professor Robert Shiller, in his book Irrational Exuberance, popularized a metric called the Cyclically Adjusted Price-to-Earnings ratio (the CAPE ratio or sometimes the Shiller ratio). It attempts to correct for high growth using the average inflation-adjusted earnings over the prior ten years. As such, it looks at trailing earnings rather than forward earnings expectations. By this measure, the September 30 CAPE ratio topped out at 39.56. (See Figure 1.) Historically the CAPE ratio for the S&P 500 has a mean of 21.8 with a one standard deviation range (roughly 68% of the time) between 12.5 and 31. When the ratio gets above 30 and up to near 40, prognosticators claim the market is overvalued and due to decline over the coming years.
Figure 1
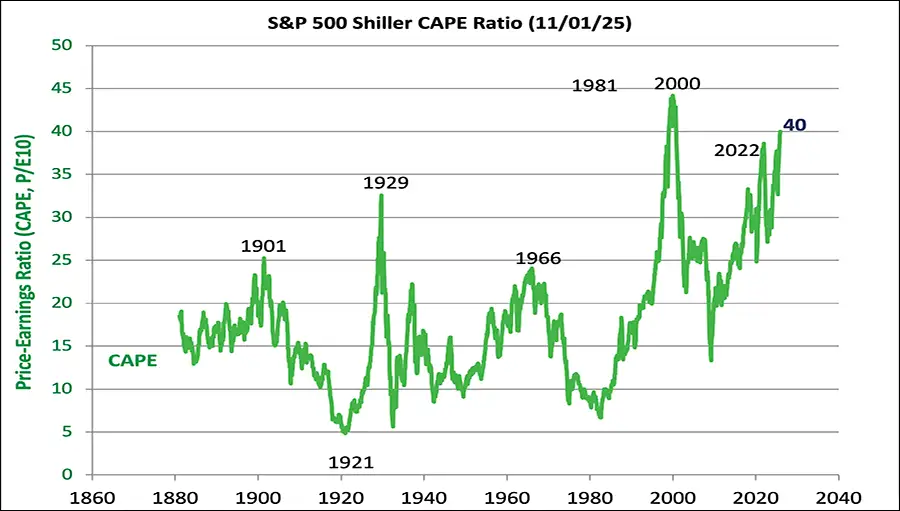
Source: S&P 500 Shiller CAPE Ratio Chart from Shillerdata.com
While not a perfect predictor of future market returns, high CAPE ratios are associated with the tops in 1999 and 2021, though not in 2007. There are limitations to this metric, including the use of backward-looking data to predict the future, company share buybacks skewing data, and changes to the composition of the index over time. Structural changes to the growth of the economy and low interest rates can also disrupt the predictability of the metric. Earnings growth rates boosted by technological advances like the current AI wave could mean that elevated valuation ratios are justified. However, the CAPE ratio may be another sign that we should be prudently skeptical of elevated earnings expectations, and that we should periodically rebalance portfolios with overweight exposures.
Is an AI Bubble Building?
Generally accommodative Fed policy is a positive for 2026 GDP growth and earnings expectations. The promise of AI to improve productivity, and the associated investment cycle, will also help to drive economic growth in the coming years. In some market sectors, AI implementation may also curtail job growth, but AI productivity improvements should also help keep a lid on price inflation. The exact economic ramifications and associated timing are hard to predict. What we are seeing is a lot of investment in AI infrastructure—computer chip development and manufacturing, cloud data center buildouts, large language model development, immense electrical power demand prompting a new look at nuclear power generation, and all the associated financing demands across public and private equity and debt.
The AI boom is having an impact across many economic sectors. However, as the big technology companies invest in their own growth, and forge large commercial agreements with each other, they have created a circular economic dynamic that gives us pause. The interdependence of these companies, the astronomical sums anticipated for capital expenditure, and the promised future revenue contracts all lead us to believe there is risk in the system that would be prudent to watch closely. We are seeing market action and hearing about some high-profile investors taking profits off the table in AI-related investment portfolios. The market run-up the past few years implies there are a lot of unrealized gains embedded in these positions. Investors trying to preserve wealth ahead of a market correction is normal.
With the incestuous nature of the AI buildout, most sectors are directly or indirectly involved, including technology, communications, industrial, energy, real estate, utility and financial sector companies. More than half the market sectors have some skin in the game. If there is a bubble building, economic fallout would be widespread. A lot of money is chasing these deals from both public and private equity, public and private debt. Maybe that is okay—diversified capital sources mean lower risk of capital funding shortages and better competitive pricing. However, a concentrated bet on one multi-sector investment theme of the market may also be the biggest risk to portfolio valuations in the coming years.
Rebalancing portfolios and realizing capital gains in the process is the way to manage risk for the long term. Generally, we have a positive outlook on the future growth of the economy and earnings across our portfolio companies. Owning high quality companies that can outperform through market cycles and holding them for the long term is how we construct portfolios that build and preserve wealth for our clients.
If this article raises any questions for you about how it applies to the investment of your portfolio, please reach out to your portfolio manager. Those new to Woodstock are welcome to reach out to learn how we can support their long-term goals.
— Robert B. Sanders, CFA, CPA, CTFA, Senior Vice President