Winter 2018
![]()
—Adrian Davies, Executive Vice President
2017 was a phenomenal year for stocks, with the S&P 500 Index returning 21.8%. The NASDAQ Composite Index returned 29.6%, and the Dow Jones Industrial Average returned 25.1%. Internet stocks drove the market, but the Dow’s cyclical stocks also performed well. Many international markets had strong double-digit gains in US Dollars as well, helped by a 10% decline in the currency over the year. The S&P 500 Index has generated positive returns for fourteen months in a row, the longest such stretch since 1959.[1] Stock market volatility also has fallen to the lowest level we have seen in years. This strong, consistent performance has buoyed sentiment and fostered some level of speculative interest.
Investors’ fears dissipated through 2017 as they gained confidence in the economic outlook. The contentious political environment in the US did not affect the broader economy. In Europe, there was no fallout from Brexit, and there was no further spread of anti-Euro sentiment. Inflation and interest rates remained subdued, while S&P 500 Index earnings grew approximately 10%. Trump’s policy agenda has also been an important factor in market returns. Initial optimism about the prospects for tax reform gave way to doubt as the new administration flailed through several attempts to repeal Obamacare. Even with the market steadily rising, stocks which benefited from the initial Trump rally in 2016 underperformed for much of 2017. Then as corporate tax reform became more likely and was ultimately passed into law, stocks likely to benefit rallied once again. They have continued to rally into 2018.
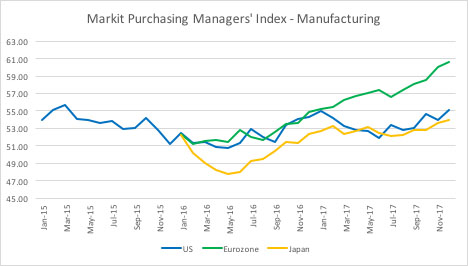
What is the reward potential and what are the risks for stocks as we enter 2018? Almost nine years old, both the stock market rally and the US economic growth cycle ought to be mature, but the bull market may have the dynamism to carry prices higher still. We are entering 2018 with a tremendous amount of economic momentum, driven by a synchronized global economic acceleration and the Trump tax cuts.
The US unemployment rate has remained at low levels for much of 2017. The current rate of 4.1% is lower today than it has been 86% of the time over the past 70 years[2]. Although the rate could continue to trend down in the near term, it shows that the US workforce is fairly well utilized. Economists arguing the US has additional unused capacity cite the country’s participation rate, which is its total workforce divided by total population. Both because baby boomers have been retiring and because discouraged job seekers aren’t included in headline unemployment rate, the participation rate remains low by historical standards. Participation suggests the economy has more capacity for non-inflationary growth than the unemployment rate indicates, even if the unemployment rate is cyclically low relative to its own history. Consumer confidence and high yield bond spreads corroborate the unemployment rate in suggesting that we are in the mature stages of the current business cycle. However, wage growth and inflation, which usually appear in the latter stages of an economic cycle, have so far remained dormant. With few indications of overheating, the economic expansion and bull market may have further to run.
US GDP growth itself has shown modest gains in the 2% range, suggesting one of the reasons for the economic expansion’s duration relates to its moderate pace. Furthermore, the economic expansion hasn’t been without setbacks. Despite steady economic growth, the US stock market suffered through five quarters of earnings recession, in which S&P 500 earnings fell year-on-year due to falling oil prices and a strong US Dollar, returning to growth in the third quarter of 2016. Other countries have experienced recessions since 2009, holding back the global recovery.
At the end of a bull market, signs of excess are typically obvious for those willing to see them — a flurry of initial public stock offerings rising 100% on their first day trading, or no-income, no-asset mortgages to home buyers. Then again, having experienced two epic market bubbles in the past 17 years, it is possible that the current economic expansion might not reach the same level of euphoria. We might consider the speculative nature of Bitcoin and other cryptocurrencies to be a sign of excess, and in the fullness of time, stock investors may find themselves relieved that speculative fervor was channeled into Bitcoin rather than stocks. Although the nominal value of cryptocurrencies is about $500 billion spread across the globe, [3] we don’t believe cryptocurrencies are big enough to impact developed economies significantly.

Source: Bloomberg
Source: FactSet
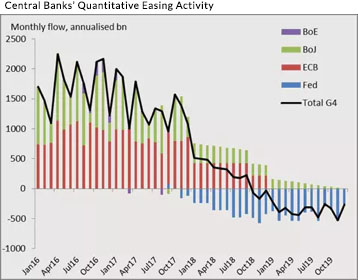
A more important indication of excess, though not “animal spirits,” might be negative interest rates on European sovereign and corporate bonds. The Financial Times reports that $11 trillion worth of bonds trade at negative interest rates.[4] Negative interest rates are hardly justifiable – investors would likely be better off storing their cash in vaults than paying others to borrow it. Many bonds trade at negative yields because the European Central Bank (ECB) and the Bank of Japan (BOJ) continue to buy bonds as part of their management of monetary policy. Negative bond yields make even less sense in the context of accelerating economic growth spurring greater demand for capital. Without central bank intervention, the current level of interest rates would most certainly correct, but central banks change course slowly.
In October 2017, the ECB announced plans to begin scaling its bond purchases down to €30 billion per month from €60 billion per month. The Bank of Japan has made modest adjustments to its quantitative easing program, although it has yet to change its policy guidelines. The US Federal Reserve is ahead of other central banks in normalizing monetary conditions. The Federal Reserve stopped its bond buying program in October 2014, and raised interest rates for the first time this cycle in December 2015. The Fed then decided to start letting bonds on their balance sheet mature without replacing them in September 2017. The Fed is currently allowing $20 billion worth of bonds to mature per month, a manageable amount for the markets to absorb at present. However, the Fed’s plan is to increase this amount by $10 billion per quarter, such that the Fed will be rolling off $50 billion of bonds per month by the fourth quarter of 2018. In all, the Fed expects to shed $420 billion of bonds this year, approximately 9% of its balance sheet. Furthermore, the Fed should exit the year with bonds maturing at a $600 billion annualized rate, a significant supply for the markets to absorb calmly. The recently passed tax cuts could increase the Federal deficit by around $200 billion this year, adding to the supply of bonds.
Source: Financial Times
The Fed may modify its plan up or down as conditions warrant, but it can take up to two years for interest rate hikes to impact the economy. FOMC Committee members don’t know how the cumulative effect of five rate hikes to date will play out in the markets or the economy. The Fed has been raising rates in anticipation of higher inflation, and there are reasons to believe inflationary pressures are building, even though we have seen little of it. If inflation were to take hold across the broader economy, the Fed could still be faulted for having held monetary policy too loose for too long. On the other hand, raising interest rates with very low inflation risks stifling economic growth unnecessarily.
Eight and a half years on since the Fed began its quantitative easing program, it’s hard to argue the Fed has effectively used monetary policy to raise inflation. The last two business cycles had more to do with asset price bubbles, while perhaps these banks were keeping a watchful eye on inflation. Asset prices are in fact much more sensitive to monetary policy than either the economy or inflation are, with the incumbent risk of fueling market bubbles. A better understanding of the risks may be a major reason why the Fed has been reversing course lately.
Are stocks overpriced? Back in early November, S&P 500 Index earnings forecasts probably should not have factored in Trump’s tax cuts. The probability of tax cuts existed, but the outcome and particulars were far from certain. Even so, analysts were expecting aggregate earnings to grow 11% in 2018, reflecting an unusually sunny outlook. As this article goes to print, sell-side analysts are still in the process of revising their 2018 and 2019 earnings estimates higher to account for lower tax rates. 2018 earnings estimates for the S&P 500 Index have moved from $146 to $150 with the passage of the law, [5] and could easily move up another 2%-5%.[6] Even though the tax cuts generally weren’t in Wall Street earnings forecasts last year, prospects for tax cuts probably were an important driver of 2017’s stock market returns. Price-to-earnings (P/E) ratios seemed high because companies’ earnings power was understated.
If changing a company’s forecast tax rate from 35% to 21% is a first order effect on earnings, what remains to be appreciated are the second order effects: the effects of the tax cuts on corporate and consumer behavior. These second order effects may well play out throughout 2018. Fiscal expansion is typically stimulative and the tax cuts expand the US Federal deficit by $1.5 trillion over ten years, with much of the stimulus coming in the early years. Offsetting potentially faster GDP growth, some of the earnings power may be competed away via pricing strategies, investment programs, and higher wage expenses. Additionally, repatriation of corporate capital overseas could very well fuel share buybacks and a wave of acquisitions.
The market hangs delicately in the balance between strong economic momentum and higher interest rates. Trading at 18.1 times $154 in 2018 earnings, assuming the upward estimate revisions continue, the S&P 500 remains at a P/E above its historical averages, just perhaps not as high as it looked previously. Higher P/E multiples make sense in the context of low interest rates, but if the Fed is changing its interest rate policy, stock prices will eventually respond. This interest rate cycle arguably looks to be more gradual than the last one when the Fed raised rates 4.25 percentage points via 17 rate hikes over two years. In addition to removing at least $450 billion of bonds from its balance sheet this cycle, the Fed has communicated intentions to raise interest rates three times this year and two next year, on the back of five completed rate hikes. Last cycle, the stock market didn’t peak until 16 months after the Fed finished raising rates. So the battle between monetary and economic forces plays out over years, not months. Being in a more mature phase of an economic expansion currently, however, the next market peak might come sooner than it did last cycle. While a modest market correction might persuade the Fed to scale back on monetary tightening, there’s further upside to the markets if monetary policy doesn’t prove to be as restrictive as expected, or if the global economic momentum and tax cuts are more stimulative than expected. The US midterm elections and new personalities on the Federal Reserve Board may also introduce interesting contours to the investment landscape of 2018.
As is usually the case, the market is full of stocks with attractive reward/risk profiles and others with unattractive reward/risk profiles. Current market conditions make finding unexploited investment opportunities harder to find, but not impossible. As you know, we look for high quality growth stocks with strong cash flow. We believe these stocks will outperform over the course of a market cycle even if they are not in vogue at the moment. To the extent that these stocks have been underperforming, they are all the more attractive against more speculative and more cyclical stocks. We will continue to look for stocks which have the best reward/risk trade-offs, while being mindful of the tax consequences where appropriate.
_________________________________________
[1] Haghani, Victor and James White, “The Message in the S&P 500’s 12-Month Winning Streak,” 11/14/2017, Bloomberg View.
[2] St. Louis Federal Reserve Civilian Unemployment data, dating back to 1/1/1948.
[3] Coinmarketcap.com
[4] Financial Times, 12/13/17.
[5] FactSet Earnings Insight, 11/3/17 and 1/12/18.
[6] Corrie Driebusch, Corrie, Michael Wursthorn and Chris Dieterich,”’Melt-Up’ Rally Propels Dow Above 26000 as Fear Turns to Greed,” 1/18/18, Wall Street Journal.