Fall 2022
—Thomas C. Stakem, Jr., CFA, Vice President
We are all data dependent and we will all react together. The entire world is data dependent. In this observer’s opinion, the phrase “data dependent” may be the second most commonly used term behind “climate change” today. Federal Reserve policy makers are data dependent. Corporate managements are data dependent, and because security analysts rely on company guidance for the bulk of their revenue and earnings growth forecasts, stock opinions and ratings are data dependent. No wonder there is so much attention and focus on this Fed meeting or that real GDP and unemployment report or what bond yields are doing and whether the curve is inverted or not. It is a large laboratory experiment in large group action and reaction.
Capital markets are supposed to discount the future which, always includes an infinite array of potential outcomes. Because of this groupthink reality, the majority will have to be late in identifying the trigger for an upturn in stock market fortunes. Today’s strategist and pundit-class behavior reminds this author of the John Maynard Keynes quip that it is better (career wise) to fail conventionally (i.e., think/act like everyone else) than to succeed unconventionally (act on an unconventional view).[1] Even though all forecasters must realize that there are long and variable lags between policy decisions and their impact on economic performance and statistics, investment opinions and outlooks inevitably emphasize the current state of affairs along with some personalized extrapolation into the future—but all with a heavy dose of recency bias.
In the US, real GDP growth was negative in Q1 and Q2. Until late September the Q3 real GDP estimate from the Atlanta Federal Reserve teetered near 0% but has since risen above two percent. Because this model generates forecasts in real time, they are volatile. That so many investors react to this type of output exposes our data dependency. Many must think that a readout on the just-ended Q3 real GDP activity will be determinative of what real GDP prospects will be two to three quarters in the future, when in fact it may not inform at all. It may just be statistical noise as it is revised several times, subsequently rendering first interpretations as in error.
The effective federal funds rate troughed at 0.08% on March 16, 2022 (https://fred.stlouisfed.org) and has risen to 3.08% as of September 30, 2022. Penciling in 0.75% increases on November 2, 2022 and December 14, 2022, the next two Fed meeting dates, would result in an effective federal funds rate of 4.58% in mid-December. This would be a 4.50% increase in just nine months. That is a lot of Fed tightening and no one can calibrate exactly the toll it will take on the economy or when. It would seem logical that less than half of the 3% uplift in rates YTD has actually been reflected in the economic data that so many depend on in terms of making their forward-looking decisions. Yet the economic pulse already seems pretty anemic with a lot of impact (twice what has been realized YTD on a time-weighted basis) yet to be felt. Looking ahead to another 1.50% of increases (a total of 4.50% for the cycle), it would seem very unlikely that the full brunt of the magnitude of rate tightening could be fully reflected in the data until Q2-Q3 of 2023.
A Long Shadow Over Growth
The fragile state of the global economy, the ongoing war in Ukraine, Europe’s inflation/recession problem, the combination of current weakening conditions, and another 1.50% of tightness have to cast a long shadow over economic growth well into 2023. Policymakers and investors (equity more so than bond) seem to have a very cavalier attitude about the potential impact on growth, unemployment and inflation. To this observer it is not at all too early to think about a Federal Reserve pausing sooner than most participants now expect, which is probably mid-2023. And once the Fed pauses, investors, armed with additional evidence of weak economic data, will conclude the next step is to pivot to ease. With the negative monetary influence of higher rates intensifying (in Q4 doubling on a time-weighted basis), far softer expected economic data can be expected, particularly if one also considers the 20% strength in the US dollar.
Tightening further into a weakening economy with a dollar that’s exerting downward pressure on the rest of the world is a recipe for widespread economic malaise. This will lead to investors quickly bidding up bond prices, and equity investors will assume that the Fed pivots will inspire some optimism, limit future economic damage (at least in terms of cycle length), and investors can begin to lengthen time horizons. First, from a few quarters to years, and before long a new cycle is on the horizon. But it all begins with the Fed pivoting to stimulate growth rather than induce a severe recession. Believing the pivot will have to occur long before the data-dependent consensus does (mid-2023) inclines this observer to long-duration investments (i.e., bonds and stocks), particularly because of their current statistical attractiveness on rolling 12-month percentage price-change statistics.
From Risk On to Risk Off
At year-end 2021, the rolling 12-month percentage change in price of the S&P 500 was +26.9%, putting it in the 87th percentile of rolling 12-month percentage changes since December 1978. Fast-forward to September 2022 and the rolling 12-month percentage change in price of the S&P 500 was -16.8% and in the 30th percentile of rolling 12-month percentage changes. The worst reading (-46.2%) was back in February 2009, the month before the March 2009 low that marked the beginning of the bull market of thirteen-plus years ago. That -44% negative second derivative (+27% to -17%) must discount a healthy combination of valuation (P/E change) and earnings outlook (EPS) change or deterioration.
Only time will tell how much more damage needs to occur, but this author believes 67%-75% of the bear trend in stocks has been absorbed in terms of time and/or price. (This is based on a presumption that the average bear market lasts 12-13 months and declines 33% peak-to-trough.) On that basis, the current bear market would end in February-March 2023 with the S&P 500 at 3,200, an 11% S&P 500 price decline (from 3,600). Painful but absorbable if a new bull market commenced thereafter. If the next upcycle only returns to the 4,800 high of January 2022 within three years, then stocks would appreciate 12% per annum and return 14% per year including dividends. Relative to the remaining risk of 11%, that is a very favorable reward-risk relationship for an equity investor. This is illustrated in Figure 1.
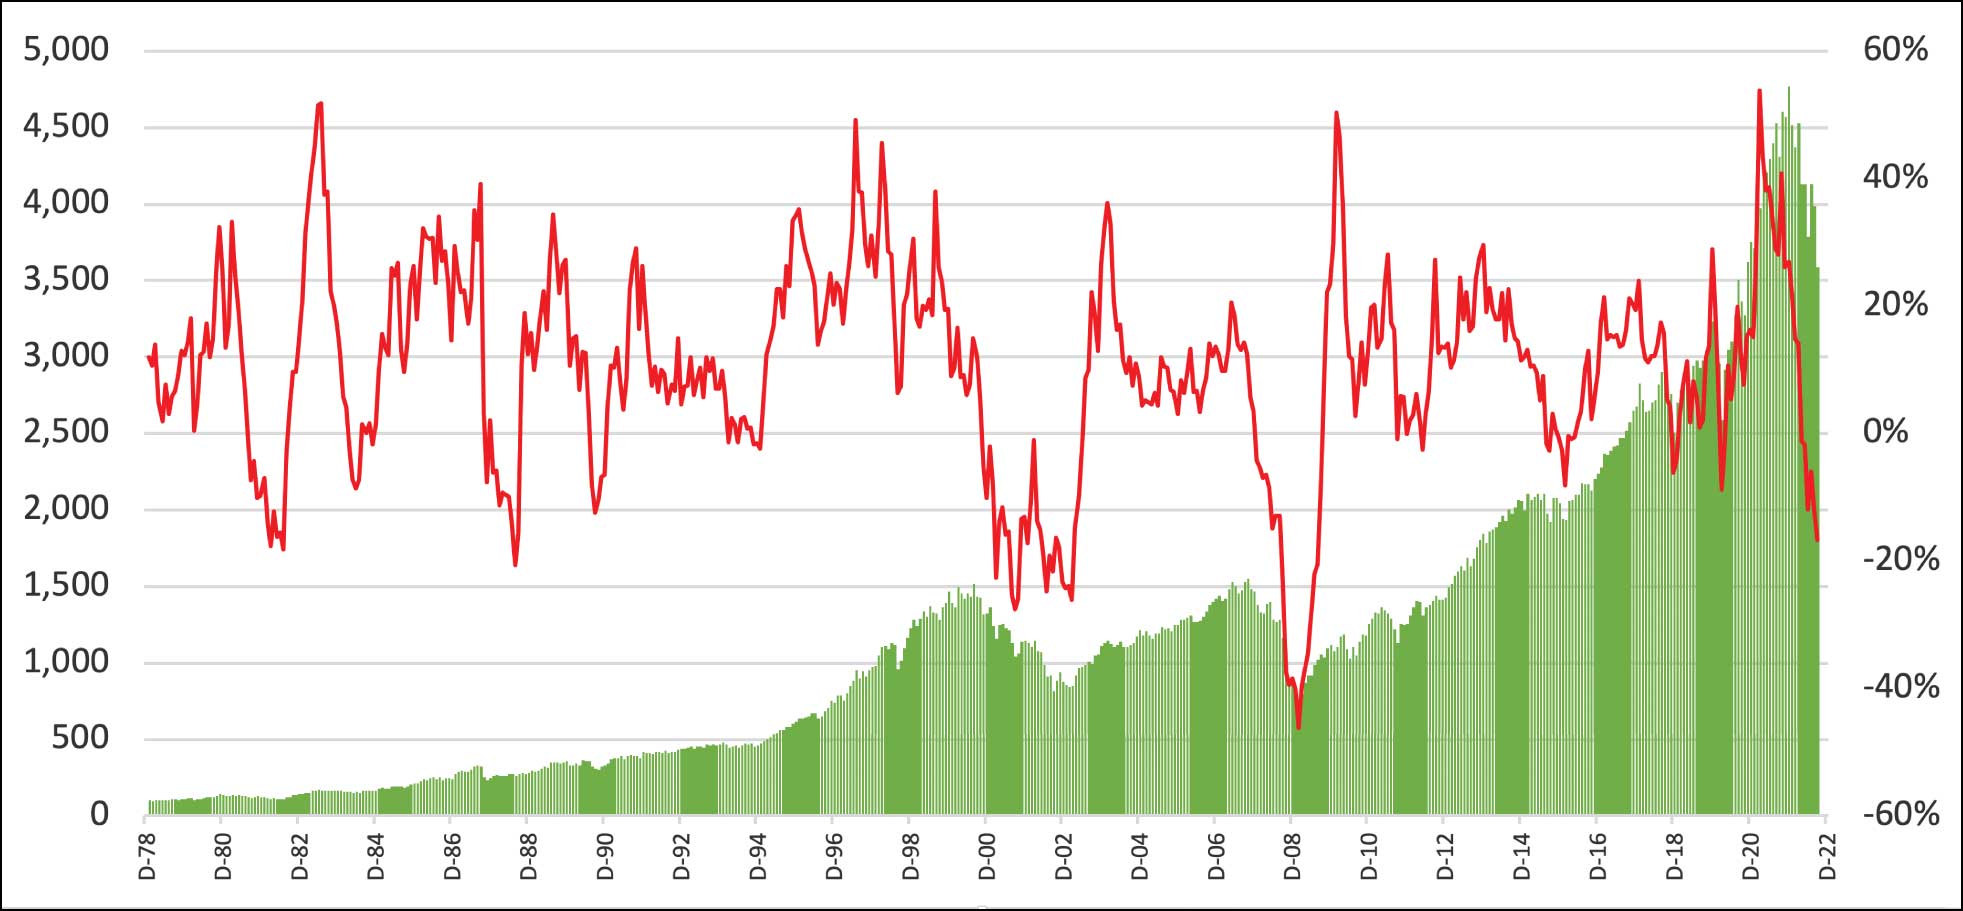
Figure 1. Rolling One-Year (12-Month) Price Change vs. S&P 500
Source: FactSet – all charts use FactSet historical pricing data
latest -16.76% 9/30/22
average 10.31%
median 11.92%
minimum -46.25% 2/28/09
maximum 53.71% 3/31/21
Several spikes down in the rolling 12-month return are visible in Figure 1, with the eye naturally grabbing several -15% or -20% readings that correlate with low absolute S&P 500 levels. While the February 2009 level did register a much lower -46.2% reading than currently, the next few months will exceed -20% because of high base-period price effects on the comparisons and be on a par with those red figures in the 2001-2003 period visible on the chart. Only the prospects of a very hard landing impact on earnings combined with pronounced dollar strength could weaken stocks to the extreme of February 2009, in my opinion.
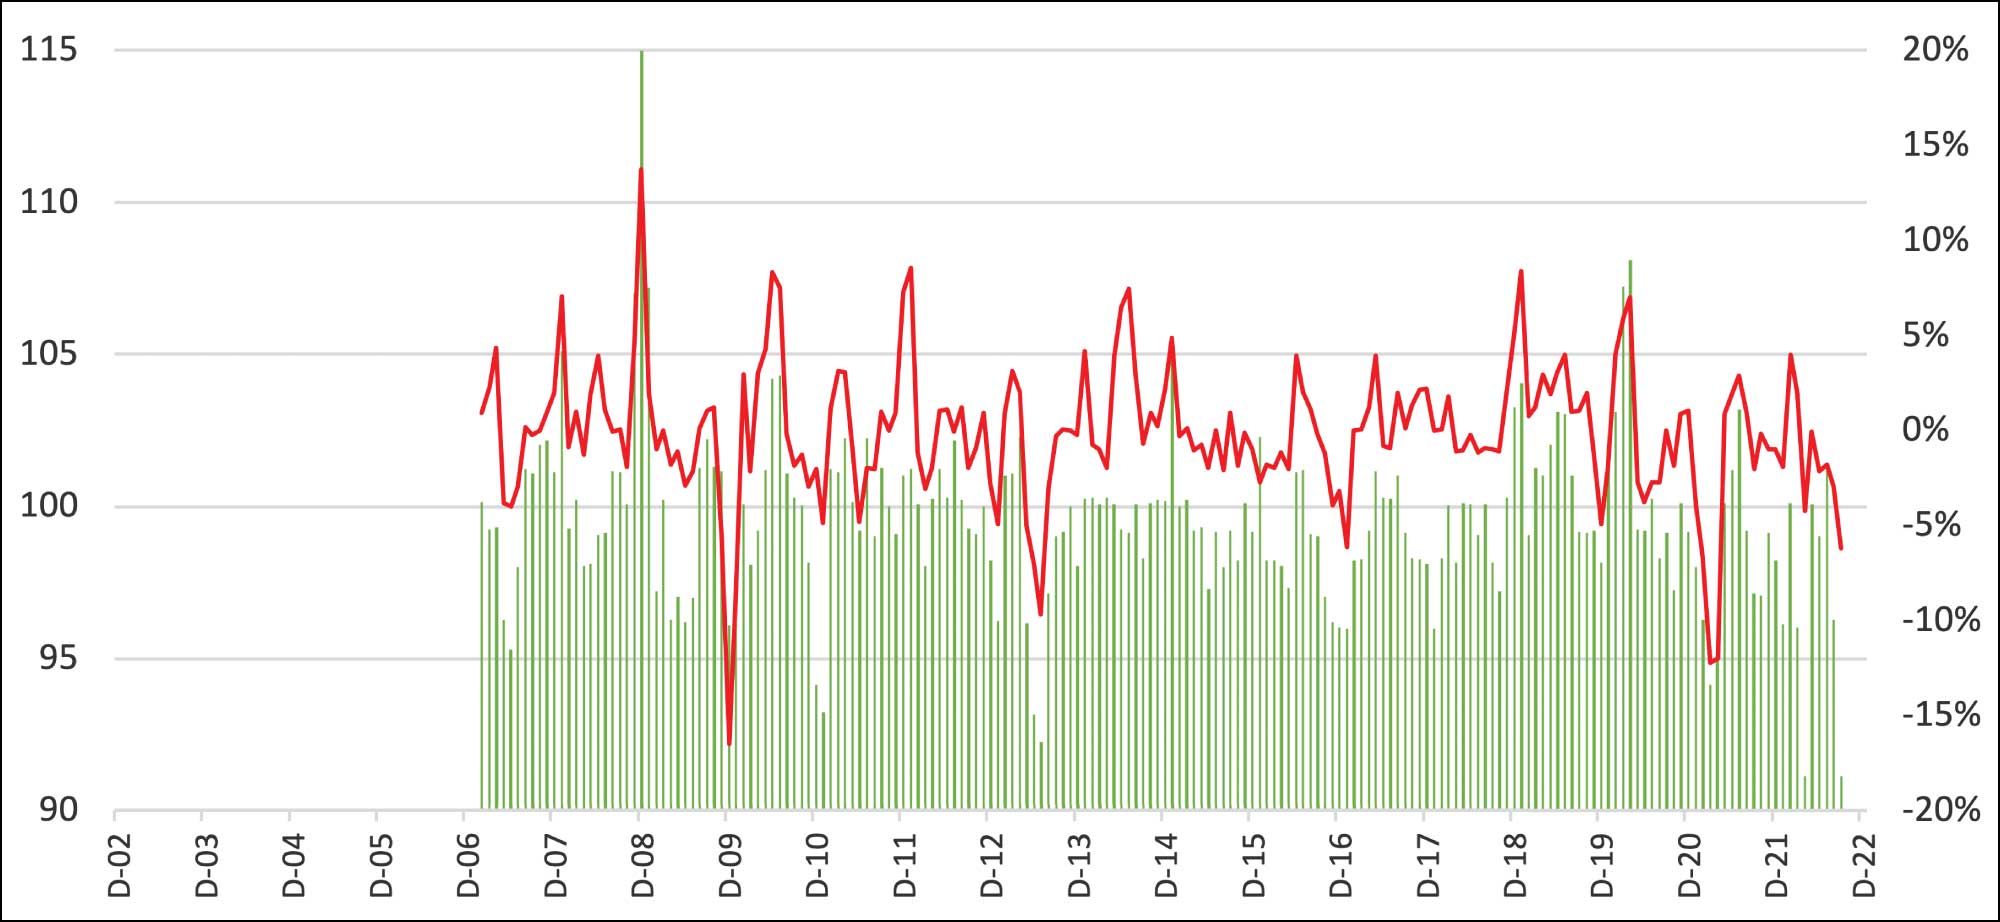
A similar insight is available for bonds using the 10-year US Treasury bond. Again, the sole focus is on rolling 12-month percentage price change. There is a strong correlation between the rolling price change and the Treasury bond price. In both instances, when the accumulated percentage price change over rolling 12-month periods is low, one can be assured that the stock or bond index, in this instance, is low. Patient investors would buy the plunging red lines as that is when appreciation opportunities are presented.
Familiar red-line downside plunges also align with low 10-year Treasury bond prices. Yields up, prices down (see Figure 2).
Figure 2. Rolling One-Year (12-Month) Price Change vs. UST10
 Source: FactSet – all charts use FactSet historical pricing data
latest -6.18% 9/30/22
average. -0.09%
median -0.05%
minimum -16.46% 12/31/09
maximum 13.73% 12/31/08
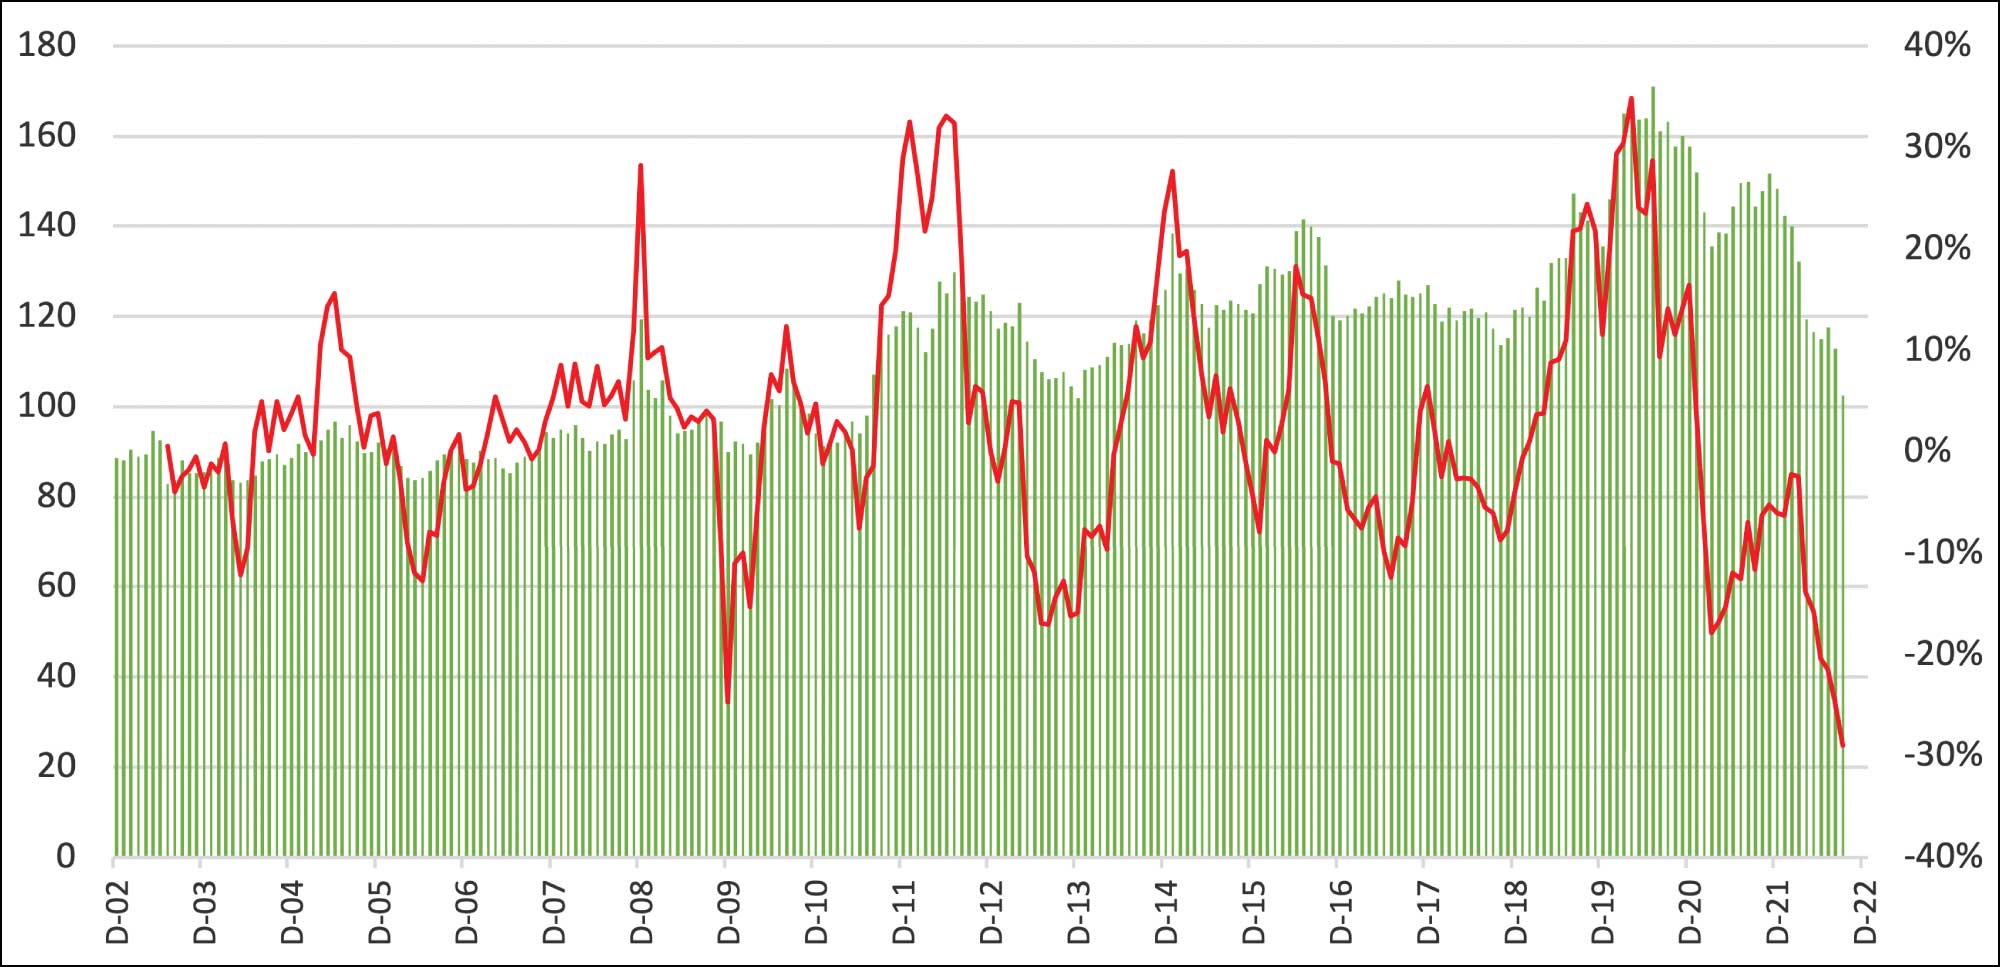
Because TLT (iShares 20 Plus Year Treasury Bond ETF) is widely followed and traded, its price/performance profile corroborates with its shorter-maturity cousin, the US 10-year Treasury. It also provides insight into bond appreciation and when buying opportunities might present themselves. The TLT duration is about 18 years while the 10-year Treasury is about 8 years. So, the duration (sensitivity to changes in interest rates) is more than double for TLT. Note that TLT also offers a longer data history (2½ years more) than the 10-year Treasury per our data source (FactSet). Currently, the TLT rolling 12-month percentage price change is -29%, putting it in the 0% percentile as it is a record low reading (see Figure 3). The 10-year Treasury rolling 12-month percentage price change is -6.2%, putting it in the 4th percentile of all readings. TLT has 232 rolling 12-month periods slightly higher than the 10-year Treasury’s 189 rolling 12-month periods. The higher-duration influence of the TLT is certainly evident in the numbers. Bonds have been pummeled and longer-term-oriented investors should be attracted to, not shunning, long-duration sensitivity because of the favorable reward-risk relationship.
Figure 3. Rolling One-Year (12-Month) Price Change vs. TLT
Source: FactSet – all charts use FactSet historical pricing data
latest -29.01% 9/30/22
average 1.98%
median 0.64%
minimum -29.01% 9/30/22
maximum 34.85% 4/30/20
3 P’s: Pivot, Peace & Probabilities
While the most likely trigger for a Fed pivot is a weaker-than-expected US economy, a currently unlikely source could also be a negotiated peace settlement between Russia and Ukraine. Although a near-zero-probability event currently, momentum could build quickly should attractive exit paths appear for Messrs. Putin and Zelensky. The absence of the war factor would reduce investor anxiety over all the macro factors that now distract investors from thinking and investing for the long term. Lower energy and food inflation expectations and positive thinking about the normalization of supply chains would further reduce structural inflation, leading to more tangible evidence for policymakers that inflation had indeed rolled over and that it would be time to nurture growth for a struggling global economy. Another benefit would be a reversal in the dollar’s multiyear strength. This would be positive for commodities as well as emerging market economies.
In any case, the cumulative probability of weakening macroeconomic data and favorable geopolitical developments is an alluring combination, particularly with investment returns having turned so negative so quickly since year-end 2021. The clearest example is the 60% equity/40% bond Vanguard ETF (VBAIX), the fiduciary standard, which is down 20% YTD through September 30, 2022, the worst performance in over forty years.
The probabilities seem high that both the stock and bond markets have priced in the worst of the outlook and little of the potential of pivot or peace developments.Asset Class Expected Returns
For the first time in a few years, reasonable expected returns appear to be positive for the next five years for all three asset classes: Cash, 3%-5%; Bonds, 5%-7%; and Equity, 0%-10%. The old reliable 60% equity/40% bond diversification standard has a solid chance of providing a positive absolute and positive real rate of return in contrast to the YTD -20% blended asset return (VBAIX). That’s because both bonds and stocks have declined at the same time and at about the same rate due to the Fed’s aggressive approach to fighting inflation, after ignoring evidence of it for quarters. The notion of inflation being “transitory” has been all but forgotten in recent months.
The passage of time should allow base-period inflation effects to wash through the system and the data, and allow supply chains to normalize. Targeted fiscal measures to incent the supply side could return secular inflation to much lower levels than the 8%-9% reported levels of late. Core or enduring levels of inflation are lower, but admittedly high, in the 4%-5% range, and could likewise be worked down over time, perhaps not to 2% but into the 3%’s is a high-odds probability. The capital markets are in the process of adjusting to that environment but are also buffeted by a fracturing global economy that is bent on creating parallel supply chains because of de-globalization and political systems while a costly and deadly war is occurring in Ukraine. Its related sanctions have also caused heightened inflation and forward supply uncertainty in important areas of energy and food production, leaving most of the world precariously positioned due to having weakening economies at a time when a 20% stronger dollar is raising the cost of these items to well beyond affordable levels.
In less than a year, the investment backdrop has dramatically changed from improving confidence post COVID-19 with generational low interest rates and high equity valuations to a war-torn, disrupted global economy battling energy and food inflation and central bankers intent on implementing positive real interest rates to slow the economy further and bring down inflation. At such times when the economic and investment outlook becomes near invisible, it is always wise to consult history. While history doesn’t repeat exactly, it can inform: when the invisibility has led to despair, opportunities present by merely looking at the performance return data which we have provided in Figures 1-3.
High confidence and enthusiasm inevitably correlate with strong past investment performance, while emotional panic and investor despair correlate with poor recent returns and low expectations of the future. At such times as now, one’s forecast of GDP or earnings growth or interest rates or the dollar or how much to pay for growth are very low confidence because of all the uncertainty that can be cited. But history teaches that those psychologically tormented periods are when the best opportunities for low-risk entry occur for an investor. The data suggests that we are now in that period. While indiscriminate selling has perhaps not occurred, the internal market statistics are consistent with the process that normally gets to such a point.
Clearly, the S&P 500’s June 17th low of 3,637 did not hold and has been undercut by 4% to 3,492 as this article is being written. Pinpointing the precise low is a fool’s errand as no one knows what the “right” earnings per share or P/E multiple is for the market overall or a particular stock. If it’s $200 of EPS and 16x for the S&P 500, then a 3,200 market low could be in our future. But earnings could be higher or lower than that as well as the market P/E. Investors could capitalize decimated earnings at a higher-than-imagined P/E because long-term investors will value the market on trend earnings, not just a below-trend point in time. In emotional markets those investors are more likely to dominate and set pricing than short-term, panic-driven investors.
The main point is that while 3,600 wasn’t the low, it is likely near enough in terms of price and time that an investor with a multiyear time horizon has to believe that purchases made in these conditions have a high probability of achieving excellent future absolute returns, likely well into double digits. And well in excess of what will, by then, be receding inflation.
The best time to buy stocks is not when the sun is brilliant outside and all the meteorologists are calling for nice weather to continue, but when the outlook is dreary, rainy, no sunshine for days with no warm fronts on the horizon. Psychologically, it is easy to invest when things look bright and sell when things look hazy, bleak or hopeless. This dichotomy between the economic or stock market cycle and the investor’s psychological cycle is why individual investor performance materially trails that of the equity market over time. Studies have shown that where the S&P 500 has earned 10% annually over time, individual investors have fared much worse, often only earning 50%–60% of the market return.[2] The difference is due to being wrong-footed at important times, which results in considerable frictional cost of market timing. Emotion is very costly in investing.
The long-term investor’s challenge today is to recognize where in the cycle we are currently and see within a fairly short time the meteorologists will again be calling for bright and sunny weather. Then “risk on” conditions will resume and a return to previous highs (4,800) or beyond will occur. But for now that cycle can only be glimpsed. It cannot be dimensioned as too many variables (GDP, profits, interest rates, inflation, P/E, the dollar) need to come into sharper focus. There are not many “free lunches” in the investment world but there are two important ones: portfolio diversification (in both numbers of economic sectors and numbers of stocks) and investor time horizon. Thirty to fifty stocks dispersed across eleven economic sectors fulfills the former while a five-to-ten year minimum investment horizon exemplifies the latter.
Investors with their focus on the long term should be well served by availing themselves of the ~25% market decline (~40%-50% for individual stocks) in 2022. Uncertainty has clouded the crystal ball, leading to opportunity. This could persist until investors begin to sniff out the timing of the Federal Reserve pausing, which will kick off less restrictive monetary conditions and will lubricate economic growth as well as lower the discount rate applied to future growth. This should result in another multiyear period of very attractive equity returns. We are anxious for the capitulation to occur, as it will usher in several years of positive investment returns and make the current red numbers worth enduring.