
The S&P 500 Index performed a most spectacular “V” in the first half of 2020, first falling 33.9% through its March 23rd low, then rallying 38.6% through mid-year. This performance included the steepest plunge and the fastest rally in 90 years.[1] The wild ride left the market still down 8.4% from its February all-time high and down 4% from the beginning of the year. The index returned 20% in the second quarter. Stocks rallied, anticipating a treatment for COVID-19 and an economic recovery turbocharged by both fiscal and monetary stimulus.
An Economic Blow Like No Other
The National Bureau of Economic Research declared that the country entered a recession in February. US real GDP fell at a 5% annualized rate in the first quarter, and it looks to be down at a 35% annualized rate in the second quarter. Changes in GDP are typically magnified because they are calculated as quarter-over-quarter changes presented as annualized rates, but the economic decline could well be the swiftest in the nation’s history.
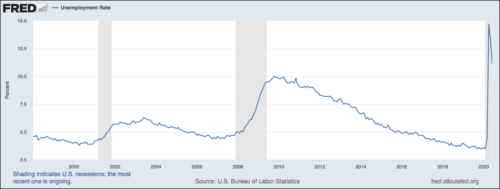
Mirroring the sharp fall and rise of the market, the economy has been rebounding in rapid fashion. The US economy added 2.7 million jobs in May, and another 4.8 million in June with shelter-in-place orders lifting and businesses reopening. The unemployment rate stood at 11.1% at the end of June, down from a peak of 14.7% in April. Many furloughed workers were recalled to their jobs. Even with the unemployment rate coming down, the economy still employs 14.7 million fewer workers than in January.[2] For comparison, unemployment peaked at 10% during the Great Recession, and during the 11 years since, the economy added 22.5 million jobs.
The economy is now expanding month-over-month, as reflected in a consensus forecast for 20% annualized quarter-over-quarter GDP growth for the third quarter. Even so, third-quarter economic activity looks to be down 6.7% over the same quarter a year ago. The worst year-over-year decline of the 2008-2009 recession was 3.9% (in Q1 2009).We’ve fallen into an economic hole 15 feet deep, and now we’ve climbed 5 feet up from the bottom.
On a day-to-day basis, the stock market rises when there’s positive news of COVID-19 treatments, and falls when there’s news about continued spread of the disease. Investors understand that the direction of this market depends most critically on the development of a vaccine, as we can’t be fully confident about returning to our prior activities until we are immune. With over 140 efforts underway around the world to develop treatments, including 18 in human trials,[3] we are confident that a vaccine will be developed, but both the timing and efficacy remain unknowns at this time.
Unemployment Rate Since 2000
A Slower Grind from Here…
People are travelling much less, and most activities involving crowds have been cancelled. Business offices in Massachusetts, for example, are not allowed to operate at more than 50% of capacity. Public transportation is one bottleneck. Schools and what to do with children are another. Restaurants may or may not be operating at 50% of capacity, helped during the summer months by outdoor seating. It’s hard to see these restrictions improving until better treatments for COVID-19 can be found.
The longer we endure this period of waiting for a vaccine, with an economy hobbled by the pandemic and by social distancing measures, the greater the economic fallout and therefore the longer it will take after a vaccine is distributed for the economy to recover. To the extent that many small businesses are operating at 50% of capacity, their cash flows are severely curtailed. Despite the government’s best intentions to help, many small businesses were left out or did not receive anywhere near the amount of Payroll Protection Program funds they will need to carry them through this difficult period. Karen Mills, a former head of the Small Business Administration, expected that 20%-30% of small businesses won’t reopen.[4] Larger companies like Brooks Brothers, Neiman Marcus, J.C. Penney, Chesapeake Energy, 24 Hour Fitness, GNC, Sur La Table, and Hertz have declared bankruptcy. Others are likely to follow.
Consumer spending has been supported at least in part by government largess. As part of the CARES Act, people earning less than $75,000 received one-time $1,200 stimulus checks. The unemployed have received supplemental unemployment benefits worth $600 per week ($2,400 per month). More than two-thirds of beneficiaries are receiving more in unemployment compensation than they received while working. One fifth have doubled their income.[5] Rushing to put the CARES Act into effect, Congress put few limits on their stimulus plan. According to the Congressional Budget Office, extending the benefits through December 31 would mean 5 out of every [6] claimants would make more money from unemployment insurance than if they returned to the workforce.6 With these benefits due to expire by the end of July, it seems likely that Congress will extend federal benefits, albeit at a lower level. At the same time, unemployment insurance is fraught with fraudulent claims, requiring completely overwhelmed unemployment offices to be exceedingly cautious even of legitimate claimants.[7]
According to Mark Goldwein, Senior Vice President at the Committee for a Responsible Federal Budget, “we will have spent as much money in the first six months of this crisis as we did on stimulus over five years during the Great Recession.”[8] The summation of four COVID-19 related stimulus laws passed by Congress in March and April amounted to an estimated $2.7 trillion in additional spending. The Congressional Budget Office expects that 75% of the CARES Act funds will be spent before September.[9] Across the four bills, 75% of the stimulus works out to about $400 billion per month. With US GDP at about $22 trillion before the pandemic, or $1.8 trillion per month, the government is spending funds equivalent to about 22% of GDP over this five-month period. Clearly, this has gone a long way toward offsetting the economic collapse. Stimulus spending seems destined to fall off before a cure-inspired recovery will gain traction.
The CARES Act provided $150 billion to state and local governments, but given the fall-off in tax revenue, it’s likely they will need more. Required to balance their budgets, states and municipal governments have already laid off almost 1.5 million employees,[10] and without further stimulus that will continue.
In addition to the fiscal stimulus, the CARES Act and many state governments imposed eviction moratoriums, preventing landlords from evicting tenants behind on their rent. According to US Census data, “about 19% of renters were late or deferred their rent payments in May.”[11] Unless extended, most of these moratoriums will be lifted during the summer months, and the backlog of evictions will proceed. According to the COVID-19 Eviction Defense Project, about 20 million Americans are at risk of eviction by the end of September.[12] With many renters not paying, there is a domino effect whereby landlords’ ability to pay mortgages is similarly challenged, as is the ability of many unemployed homeowners. Government-imposed moratoriums on foreclosures are similarly about to expire. A reduction in government stimulus will cause still more people to stop paying their rents and mortgages. A wave of evictions and foreclosures could represent a few steps backwards in our efforts to climb out of the hole we’re in. Lenders are also forbearing on student loans, auto loans, and credit cards. Even if these moratoriums and forbearance programs are extended, unpaid debts are accumulating. With so many loans in forbearance, it’s hard for the banks to tell who is creditworthy and who isn’t. They’ve tightened their lending standards.
A second wave of the pandemic this coming winter is more than a mere possibility. Previous coronavirus outbreaks, including SARS and MERS, have demonstrated seasonal tendencies. Seasonality is consistent with the idea that the disease is primarily transmitted through the respiratory system and therefore spreads most vigorously when people are in close proximity to each other – indoors. The disease may be spreading this summer most detrimentally in climates where people are staying indoors for air conditioning. Even if a vaccine is discovered before winter, manufacturing and distributing hundreds of millions of doses will still be an incredible challenge.
Monetary Frontier
Stocks fell in the first quarter as earnings expectations were cut. Valuations also fell as uncertainty increased and as anticipated demand for capital overwhelmed supply. To offset the declining availability of funds, the Federal Reserve launched unprecedented levels of monetary stimulus, and this has helped to stave off near-term economic decline. The Federal Reserve started expanding its balance sheet — buying bonds — last September to address problems in the “repo” market. Since January, they’ve expanded their balance sheet by $2.86 trillion, from $4.15 trillion to $7.01 trillion as of June 24.[13] That works out to $571 billion per month. The most the Fed’s balance sheet increased over any six-month period during the Great Recession averaged $227 billion per month.[14] The Fed has expanded the types of securities they are willing to buy to include municipal bonds, bond exchange-traded funds, and investment-grade corporate bonds. We’ve written not infrequently about the effect that the Fed’s bond purchases have had on the stock market (see Quarterly Market Perspectives, Winter 2020). The Fed’s actions have lifted bond and stock prices, and are arguably the principal reason why the stock market has been ebullient in the face of such somber economic conditions.
To the Fed, the salutary effects of higher asset prices on the economy – enabling companies that need capital to obtain it – outweigh the risks. Near-term exigencies outweigh the longer-term implications, but the Fed’s actions engender at least two principal risks: generating too much inflation and creating an asset bubble. So far, the deflationary forces at work in the economy have been more powerful than the inflationary implications of the Fed’s bond buying. That was true throughout the recovery from the Great Recession. The Fed’s scaled-up efforts may prove out differently this time, but inflation is unlikely to be impactful in the intermediate term with so many still out of work. Furthermore, the Fed’s actions are creating excess bank reserves. For the monetary policy to create inflation, banks have to have enough confidence to lend against these reserves. It seems unlikely that banks will become confident enough to ramp up lending while pandemic-related economic fears remain pervasive. An effective vaccine and/or treatments for COVID-19 could trigger a sudden rush of economic activity, which could in turn unleash inflationary pressures. Rising inflation and interest rates could very well upset stock prices.
In the meantime, stock prices have been quite responsive to Fed policy. If Fed governors become uncomfortable with the altitude of stock prices, they may stop buying bonds. That doesn’t necessarily mean stocks will fall, but the tailwind would be taken away. The risk scenario is that the Fed continues its aggressive monetary policy and its bond buying generates a stock price bubble. Yes, most investors want stock prices to rise. The risk is not so much that stocks rise, but the likelihood that a swift and damaging correction would ensue. This is a challenge the Fed is deferring to another day.
Market Internals
The novel coronavirus looks to be something we will have to live with for an extended period, with social distancing measures continuing to limit economic activity. Given the hurdles ahead, we shouldn’t assume either GDP or corporate earnings will continue to rebound rapidly to their prior levels. Stocks are likely to react positively to news of COVID-19 treatments. Even once a vaccine is widely distributed however, it will take time for the economic wounds to heal.
Fed priming has encouraged investors to see through 2020’s depressed earnings to consider what earnings and valuations will look like in a more normal economic environment. S&P 500 Index constituent earnings are expected to decline 22% for the full year, including a partial recovery in the second half, according to FactSet. The index ended the quarter trading at a rather expensive 24.5x 2020 estimates, and 19.0x next year’s very difficult-to-predict earnings. The 2021 earnings consensus forecast happens to be comparable to what index constituents earned in 2019. Stock prices may be justified anticipating an earnings recovery, but the market’s price-to-earnings multiple remains on the high side even then, and the pace of recovery remains in doubt. Investors may still be forced to temper their expectations, with GDP and earnings taking two to three years to recover to their prior levels. The US presidential election and US-China relations are two X-factors which could further complicate the path to recovery.
Although the Fed’s fire hose of liquidity is driving both stock and bond prices higher, its forces aren’t distributed evenly. The effects are unevenly distributed across the economy more broadly – and that’s also true among stocks. Large capitalization technology stocks have continued to do well. Some market commentators have compared this favored group of stocks to the era of the Nifty Fifty stocks in the late 1960s and early 1970s. So far this year, the five largest companies in the S&P 500 Index by market capitalization – all technology stocks — were all up in the first half of the year while the index overall was down 4 percent. In the first half of this year, Apple was up 24.9%; Microsoft was up 29.1%; Amazon was up 49.3%; Alphabet was up 5.8%; and Facebook was up 10.6 percent. Three of these companies now have market capitalizations over $1 trillion (Apple, $1.58 trillion; Microsoft, $1.54 trillion; and Amazon, $1.38 trillion). Since the S&P 500 Index is weighted by market capitalization, these names have been driving the index higher. Excluding these five largest companies, which account for an estimated 22% of the S&P 500’s entire market capitalization, the index would have been down about 8% year-to-date (Woodstock estimates). The five largest stocks are more expensive than where they have traded historically and they have lifted the market’s overall price-to-earnings ratio. To be sure, sheltering in place has advantaged these stocks over others, accelerating technological adoption trends.
There are other technology highflyers and speculative names that have far exceeded the five largest technology names both in capital appreciation and in achieving very high valuations, but most other stocks have participated much less in the current rally. When we are freed from our COVID-19 fears, the more economically sensitive stocks are likely to rebound the most.
Woodstock’s Approach
For the sake of managing through the Federal Reserve’s continued involvement in the markets and preparing for whatever comes next, we believe it is important to hold a diversity of stocks, including those that have underperformed during the market’s V-shaped recovery. Even if the market capitalization- weighted index struggles to make further headway in the near term, the stock market still presents many opportunities which we endeavor to find for you.
We know that over the long term the market has gone up, if not steadily, then in unpredictable fits and starts. As discussed in the accompanying article One Part of Growth Investing (see page 2), jumping in and out of the market – market timing — is a treacherous business. Not knowing what the short term will bring, we believe clients are best served by focusing on the long term. We further believe that clients are best served by focusing on high-quality stocks of companies that can maneuver through whatever economic conditions arise to improve their own market positions. Clients can have confidence holding high-quality stocks through the worst of market conditions, keeping portfolio turnover low, and assuring they will be well positioned for the next bull market. Our low portfolio turnover approach further serves to be tax efficient, so clients keep more of the returns generated by their portfolios. These core tenets of our investment philosophy have served clients well through the harrowing “V”-shaped market plunge and recovery, and we are confident they will continue to do so.
Adrian G. Davies, President