Woodstock Quarterly Newsletter / Q2 2019

A long term investor usually has two time horizons in mind when thinking about investing – what will happen over the next twelve months (tactical) and what will happen over the next twenty years (strategic). Tactical thinking should take into account liquidity needs over the next year, current fundamental or valuation concerns and/or a buying reserve for expected opportunities. The strategic is normally the easier question to answer because of market history.
But the investor’s age has a profound impact as well. It is easier for a forty-five year old to think about the next twenty years than it is the sixty-five year old. For many investors their time horizons contract as they age. The importance of the tactical versus the strategic we leave to each reader to weigh and assess. And we will leave the easier, twenty year outlook, question for later.
The next year?
The two big economies – U.S. and China, the Federal Reserve and the 2020 elections hang over the short-term market outlook and could cast a shadow onto the twenty year outlook if there are dramatic fundamental changes. After raising the policy rate (federal funds) a quarter of a point at their December 18, 2018 meeting the Federal Reserve stood pat at their March 20, 2019 meeting. Lingering effects from the 35-day U.S. government shut-down, soft or weak economic data out of the U.S., China and Germany, and concerns about the outcome of the ongoing tariff negotiations undoubtedly encouraged policy makers to take out some recession insurance and stand pat on additional rate hikes. With the U.S. inflation rate well below 2% and looking docile there was no need for the Fed to be aggressive in the face of underwhelming data. Hopefully it turns out to be the pause that refreshes.
History would seem to be on the Fed’s side. Note the following graph of the federal funds rate, the Consumer Price Index, and real GDP growth.
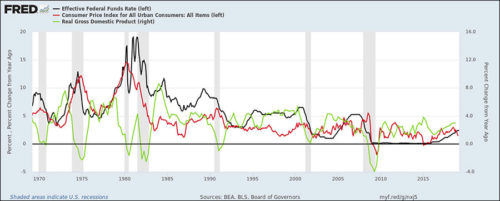
Over the fifty year period it appears that a real (i.e. positive) federal funds rate always exists before the onset of a recession (i.e., the black line above the red line). With many observers on “recession watch” in the U.S. the emergence of a positive real fed funds rate in November 2018, the first time in over a decade (since Q4 2007), had to be noticed by the Federal Reserve governors. With U.S. inflation static or even falling, any further rate hikes would only push the real federal funds further into positive territory and increase the risk of a recession. So the Fed governors elected to “do no harm” and defer another rate increase (it would have been the tenth since 2015). In fact, the uncertainty of forward economic data must have been so palpable that the Federal Reserve hinted that there would be no hikes over the rest of 2019. On this score they will be very “data dependent”. If the current uncertainty leads to more concern about the onset of recession as a result of subsequent economic reports the Fed will begin cutting rates to engineer a “soft landing” or, at worst, a mild recession. If stronger data emerges from the U.S., while Germany and China’s stimulus policies kick-in triggering economic reacceleration, the Fed would be in position to resume their pattern of quarter-point hikes.
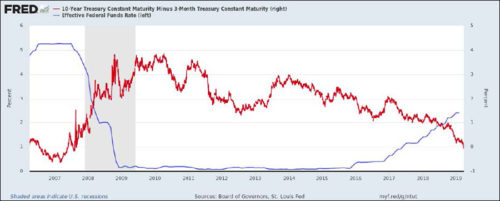
The much talked about yield curve, sloping downward for years as seen below, really picked up steam in the last two years as the spread between the 10-year Treasury yield and the 3-month T-Bill yield narrowed two percentage points to below zero in March 2019. At some point nine policy rate tightenings by the Fed will begin to restrain an economy that has absorbed the benefit of lower corporate taxes, de-regulation, and large budget deficits more than has already been felt. Perhaps it was time for the Fed to sit back and observe labor market conditions, the lack of inflation discomfort (i.e. sub 2% inflation), and the health of the other leading global economies for a quarter or two.
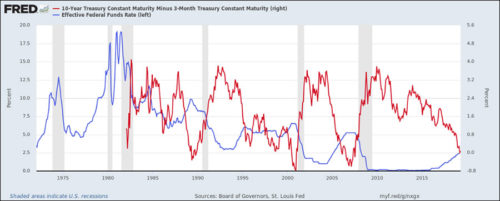
As can be seen in the graph below three times in the last fifty years whenever the yield curve inverted (Q2 1989, Q4 2000, and Q1 2007), there was either a cessation of fed funds rate hikes or a decline had begun. No doubt the governors had access to this chart in March and it inspired respect for George Santayana’s famous admonition about those who cannot remember the past being condemned to repeat it.
The next twenty years?
Although the U.S. economy has grown so large that incremental growth has to slow, a look at history provides evidence and comfort that forward earnings growth of 5%-6%-7% should be in prospect. For long term growth investors, capital appreciation is primarily a function of earnings growth (P/E change is the other factor). On this point history is clear – equity prices follow earnings growth.
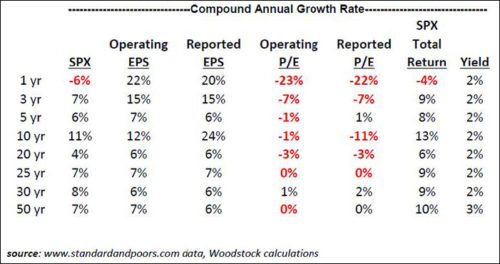
1 1968 operating EPS data assumed to be 1968 reported EPS data as operating EPS was not available.
Two things stand out about the above table. Over long-term periods (20 to 50 years) the compound annual earnings growth rate has been 6%-7%. It is also obvious that in periods when stock price appreciation exceeded the earnings growth rate P/E expansion was the positive factor. Conversely, in instances where stock price appreciation lagged earnings growth, P/E contraction was the explaining negative factor. Over long periods of time (25 to 50 years) P/E change is minimal. This must have inspired the expression that stock prices follow earnings. But over shorter periods of time the P/E influence can be quite dominant. In 2018, for example, the S&P 500 fell 6% in price while earnings rose 22% on an operating basis and 20% on a reported basis. The P/E ratio fell 22%-23% in 2018, depending on the earnings series used (operating or reported). For the long-term horizon investor, the P/E influence is a minor factor, hovering near zero, highlighting the importance of earnings growth. Dividend yield was a factor adding a steady 2% to compound annual total return each period.
The law of large numbers applies to an economy’s growth rate just as it does to a large individual company. The larger the company the harder it is to grow at high rates. At $20-$21 trillion the U.S. economy should logically have a harder time growing than any point in the past when it was a fraction of its size today. Similarly, the S&P 500 will have a harder time compounding earnings 6%-7% a year over the next twenty or more years. Haircutting the historical growth rate to a range of 5%-6% seems prudent, particularly after the boost provided from tax reform and share buybacks of recent years. Assuming no P/E change over the period results in S&P 500 appreciation potential of 5%-6% over the next twenty or thirty years. Conservative growth rates are also justified after reading the latest (January 2019) Congressional Budget Office (CBO) projections to 2029 that include higher individual and corporate taxes that are likely after the 2017 tax act expires at the end of 2025.
Since the market P/E ratio is unlikely to be a material influence on capital appreciation over twenty and thirty year periods, an investor only needs to be comfortable that interest rates and/or inflation do not surge higher during the forecast period to be confident of a 5%-6% annual appreciation assumption. On this score, each individual needs to evaluate whether $1 trillion annual budget deficits beyond 2022 (only $900 billion in 2019), on top of the $22 trillion national debt (http://www.usdebtclock.org/) currently, will at some point exert volatility and upward pressure on interest rates. A tsunami of new U.S. Treasury debt is coming over the next decade and it is not clear if the available global savings pool will be willing and able to finance the U.S. deficit. Buyers having to be enticed by ever higher yields seems a safe assumption at this point. Here the CBO projections seem generous in that they estimate the average interest rate on publicly held debt will rise from 2.4% in 2018 to 3.5% in 2029 as the publicly held debt rises from ~$16 trillion to ~$29 trillion and will represent 93% of GDP versus 78% in 2018.
Conclusion
Five to six percent annual earnings growth and equity appreciation over the next twenty years is a sound planning assumption. Neither cash nor bonds can provide capital appreciation potential. Bonds theoretically could if 10-year yields ever fell from their already low levels of ~2.4%-2.5%, but that seems unlikely. Long term investors seeking growth have only one major decision – their percentage allocation to equities. Integrating the tactical and the strategic is the long term growth investor’s challenge.
As the table on page 3 shows, in December 1998 a long term investor with a twenty year time horizon investing in the S&P 500 would have recorded 4% compound annual capital appreciation through December 2018. This was less than the 6% S&P 500 annual earnings growth because of 3% per year P/E contraction. This contrasts with the 14% compound annual appreciation over the previous twenty years that the long term growth investor would have recorded. Appreciation in this prior period was comprised of 6%-7% annual earnings growth and 7% per year P/E expansion. While that is indeed a wide spread in terms of annual appreciation achieved (4% to 14% annual) over those twenty year intervals, it does highlight how appreciation is tethered to earnings growth and how P/E changes can often rival earnings growth as driving influences. Three percent a year P/E contraction in the recent example and 7% a year P/E expansion in the earlier timeframe example put a healthy range around potential outcomes. Today’s twenty year growth investor should plan on 5%-6% annual earnings growth and hope that deficits continue to have little effect on interest rates and P/E’s. Looking back in December 2038 (twenty years on from 2018) the probabilities are high that 5%-6% a year compound annual appreciation will have been recorded by today’s long term investor.
Thomas Stakem
Senior Vice President and Portfolio Manager