Spring 2018
![]()
—Thomas C. Stakem, Vice President
The bull market just passed its ninth anniversary and most investors have to be amazed at the 331% run in the S&P 500 from 667 (3/9/09) to 2,873 (1/26/18). This near 18% compound annual total return (CATR) performance is reminiscent of the spectacular back-to-back decade performances of 18% that occurred in the 1980’s and 1990’s. But just as that period was followed by a lower return decade – the 2000’s -1% CATR, a bit of late cycle planning is prudent today.
All the key resources (human, capital, raw material) are at rising rates of utilization, unemployment and productivity are low and commodities tend to come to life late in economic cycles. Together with higher interest rates these factors will combine to make existing operating margins more difficult to maintain let alone grow from the estimated 10.3% level of Q4 2017 (source: www.standardandpoors.com), the highest level seen in the S&P 500 data since at least 2006 (we would wager in history). For contrast, the only negative operating margin quarter ever was Q4 2008 (at -0.04%). This was in the quarter before the bull market began in Q1 2009 and surely no forecaster could have foreseen the magnitude of the margin expansion that lay ahead over the nine years. A ten percentage point operating margin improvement on S&P 500 revenues of over $1,200 per share (source: www.standardandpoors.com) has been a material driver of the earnings progression we’ve seen since and has been one of the two key supports under this nine year bull market. The other driver of course was the easy monetary policy the Federal Reserve adopted initially to stave off a larger panic than what occurred and then to nurture a weak, fragile economy for much of the last nine years.
For 2018 and beyond investors are now seeking total return clarity, if not certainty, at a time of great uncertainty. As always it is the outlook for the equity asset class return that is the most difficult to forecast. We’re always either guessing or extrapolating inflation from recent experience which now is 2% plus or minus. We think we have a good handle on predicting cash returns, which typically do not have real return value and only occasionally match or exceed inflation by a small amount. Because of the Federal Reserve suppressing short-term yields to zero since Q4 2008, cash returns(money market or Treasury bill rates) have not kept up with inflation. But as the Fed normalizes rates going forward cash will likely trend up to at least a zero real return asset class providing a 2%-3% return (1.5% now, perhaps 3.5% two years from now). We know what five and ten year total bond returns will be at any given time, if held to maturity, from their yields-to-maturity (YTM). That leaves the heavy lifting in the asset class expected return exercise to be what will the total return be from equities? The interplay of dividend yield, earnings growth and P/E multiple change will determine the answer.
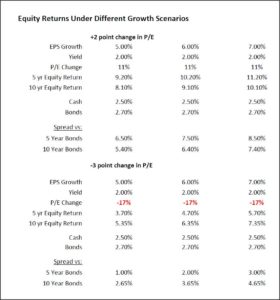
In the table below we pull together a range of returns for equities based on 5%-7% trend S&P 500 EPS growth expectations for the next five and ten years. A 2% dividend yield is also assumed. To isolate the return sensitivity to P/E multiple change we impose two further conditions: the ending P/E multiple rises 2 multiple points (+11%) and the ending P/E multiple declines 3 multiple points (–17%) from an assumed 18x level today. In the happy circumstance of P/E multiples widening further equities return 8%-11%, 5%-8% over bonds which is about in line with ninety years of history. In the P/E multiple compression case, equities return 4%-7%, 1%-4% more than bonds. While admittedly still in positive alpha territory, a 1%-4% return premia would be at the low end of a ten or twenty-five year average of equity-Treasury bond spreads.
What is eye-opening about this exercise is how these prospective equity-Treasury bond spreads prompt the question of whether one is being adequately compensated for the incremental risks of owning equities. In stable, low volatility stock markets 1%-4% may seem adequate but in periods of higher volatility and bungee jumping episodes in the S&P 500 it may seem small compensation for the volatility.
Monetary policy since the financial crisis (2007-2008) has been a tailwind for equities and this has produced a rising P/E multiple environment for the last nine years. Perhaps the biggest uncertainty in the equity return calculation over the next five to ten years will be the extent to which monetary policy is a headwind, acting in reverse to what investors have become accustomed during the last nine years.
A lot of educated guesses exist as to how many Federal Reserve rate increases will occur over the next two-three years. Will there be 3-4 in 2018, 2-3 in 2019, and 1-2 in 2020? There could be 6-9 increases which if 0.25% each would place the return proxy for cash at about 3.00%-3.75% in three years. Since the current 2, 5 and 10 year US Treasury YTMs are 2.30%, 2.60% and 2.80%, the prospect of a future inverted yield curve raises concerns regarding the impact of monetary policy headwinds on equity P/E multiples. In addition to impacting the Federal Reserve governors in their deliberations to adhere to the presently envisioned hike schedule, the performance of inflation data and real GDP growth will impact the shape of the yield curve while these interest rate hikes are occurring. If one believes that the economy has become “hooked” on free money then the prospect of these Fed hikes would incline one to believe the rate hike cycle will be short-lived because of its negative effects on the economy. On the other hand, if one holds the belief that rising rates will affirm the strength of the economy one would expect parallel moves up in 2-5-10 year yields and that a slowing economy would not necessarily follow. But like the Federal Reserve we are all “data dependent” and it’s hard to imagine that the data over the next eight-to-twelve quarters will uniformly favor one direction. Thus, volatility in perceptions and expectations are likely.
But it is hard to see how a “late cycle” investment mindset isn’t appropriate. And that entails the reality of monetary policy now being a headwind, that earnings growth will slow from the heady tax reform enhanced growth rate level of 20% in 2018 to a more sustainable trend growth rate of 5%-7% per year and downward pressure on P/E multiples.
Late cycle earnings expectations are evident in the latest S&P sector earnings outlook below as Energy, Financials and Materials are prominent earnings outperformers. A late cycle investment strategy may need to allow for more defense over offense because of slowing earnings growth and P/E compression. P/E multiples have to rise for stocks to return more than 7%-9% over the next five and ten years. After a long bull market this seems unlikely. While this would still be a respectable absolute return it would be about half of the last five calendar years’ equity return (15.8%) and about on par with the last ten calendar years’ equity return experience (8.5%). A lower 4%-7% equity return type experience is feasible if P/E multiples narrow as modeled below.
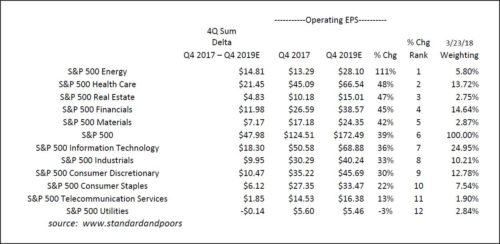
Corporate earnings growth over the next two years is also expected to come from sectors considered “late cycle”. Thus including some sector exposure different from what worked during the nine year bull market may make sense if cash availability, tax sensitivity and overall investment objectives are supportive. Discussing this with your portfolio manager is always the prudent course of action.