Woodstock Quarterly Newsletter / Q2 2019
Is the Stock Market More Volatile Due to Its Focus on Economic Conditions?
There has been no shortage of uncertainty lately. The Government partial shut-down, the US-China trade war, and Brexit have featured most prominently in the financial headlines. Rising interest rates and a weak stock market have only added to the worry that a greater market downturn could be around the corner.
In 2018, US economic growth accelerated due to tax cuts and fiscal stimulus whereas most of the rest of the world decelerated. The US stock market had outperformed foreign markets through September (+10.6% for the S&P 500 Index vs. +1.3% for the FTSE All-World Developed Ex-US Index), but subsequently, the US market corrected further than most international markets (‑13.5% vs. ‑12.5%). The S&P 500 returned -4.4% for the year, compared with -11.4% for the FTSE ex-US. In the US, low overall volatility encouraged momentum-style investing, which in turn led to a bifurcated market. There were “have” and “have-not” stocks. The “FANG” stocks (Facebook, Amazon, Netflix, and Google) and others like them led the market up, capturing the market ethos, before tumbling back down in the second half of the year. Rather than 2018 being an unusually volatile year, however, it was the prior year which was unusually calm. 2018 marked a return to a normal level of volatility, as unpleasant as it was.
What’s behind the renewed volatility? The stock market is much more focused on several policy debates than it has been in the past. The policy issues have important consequences and critical decision points are approaching. Arguably more to the point, stocks had been overlooking the importance of these policy issues and the risks they presented during the steady uptrend.
Economic Conditions
The US economy remains fairly robust. US GDP grew an estimated 2.9% in 2018, boosted by President Trump’s tax cuts and fiscal stimulus. The Bloomberg consensus believes growth will moderate, but still come in at a healthy 2.5% rate for 2019. If the economic expansion lasts through June, it will match the longest on record (March 1991-March 2001), so many argue we are due for a downturn. Some prognosticators worry about the economy being too strong, with unemployment of 3.9% and wage inflation most recently hitting 3.2%. The shortage of workers could drive wages up, which in turn would drive inflation higher. Despite the tight labor market, inflation has remained relatively low, with the Consumer Price Index most recently increasing 1.9% year-on-year, or +2.2% excluding food and energy. An approximate 8% appreciation of the US Dollar against a basket of currencies and a 22% drop in the price of crude oil over the year have helped to keep a lid on inflation.
At the same time, there are widespread murmurings that a recession may be right around the corner. A Duke University/CFO Global Business Outlook survey published in December asserted that, “almost half of US chief financial officers believe a recession will strike the US economy by the end of 2019… Additionally, more than 80% of US CFOs think a recession will strike by the end of 2020.”[i] A Wall Street Journal poll of economists found similar results: 25% expected a recession within the next year, with 56.6% expecting one to start in 2020. A further 26.4% expected a recession to hit in 2021.[ii] Further reinforcing the negative view, existing home sales (units) have fallen year-over-year in each of the past ten months.
Despite its challenges, the US remains a beacon of prosperity in the world. England can’t decide what its role with the European Union should be (Brexit), while countries on the European continent have their share of problems as well. France’s economy has been held back by sometimes violent protests from the “Yellow Vest” movement. German economic growth turned negative as the government implemented tougher emission standards on auto manufacturers. The Italian Government is pushing to increase its deficit beyond EU mandated limits. Meanwhile, the European Central Bank just ended its own version of quantitative easing (QE) in December, and is looking to raise interest rates by September.
China’s economy was slowing even before the US initiated a trade war as the government was reining in lax lending standards and excessive debt. The trade war has only made matters worse. So far however, a 5.2% weakening of the Chinese Renminbi versus the US Dollar in 2018 has made US imports cheaper, offsetting roughly half of the recently-imposed 10% tariffs. Offsetting the 25% import tariffs which the US has threatened to impose starting March 2nd might prove more challenging.
The trade war could very easily knock China into a recession, and because leverage is endemic, China’s recession could last awhile. Another outcome could be Chinese inflation. Just as we have been addressing our economic challenges with monetary policy, the Chinese are attempting the same. Monetary easing did not lead to inflation here, but inflation remains a danger of loose monetary policy.
Ironically, the pessimism engendered by these concerns could be a longer-term positive for stocks and make a US recession less likely. If people are expecting a recession, they’ll likely behave cautiously, avoiding the types of risk-seeking behavior that lead to the economic excess. The technology stock bubble of 1999-2000 and the housing bubble of 2007-2008 were caused by “irrational exuberance,” not by an abundance of caution.
Markets Are Arguing with the Fed
Of necessity, the stock market weighs in on any matter affecting future profits and economic growth. Stock, bond, currency, and commodity markets can all render opinions on economic matters, subject to interpretation, and the interpretations aren’t always consistent. One of the more pressing issues for the markets in the fourth quarter of 2018 was monetary policy, and markets were not shy to express opinions about it. When policy announcements are within market participants’ expectations, the markets remain relatively calm. If a Federal Reserve Governor, particularly the Chairman, suggests policy outside the range of market expectations, markets react more dramatically.
In addition to the monetary policy debate, the markets are “having a dialog” with Washington DC regarding both the US-China trade war and the Government shutdown. Although these government policies are creating tensions, market prices didn’t react dramatically to these issues in 2018 because most market participants expected them to be resolved before they caused major economic disruption. The markets would like to see both disputes resolved.
The S&P 500 Index peaked on September 20th at 2930.75. In an interview on October 3rd, Federal Reserve Chairman Jay Powell commented that the Fed Funds rate was “a long way from neutral, at this point, probably.”[iii] The stock market didn’t respond well to the prospect of many more rate hikes, falling 1.4% over the next two days, and, while there are always a myriad of factors affecting the market, the S&P 500 Index ended October down 6.8%. Trade tensions were heating up around the same time, with the President imposing 10% import tariffs on $200 billion worth of Chinese goods on September 24th. The President had been threatening to impose these tariffs since June.
The Fed was widely expected to raise rates 0.25 percentage points at its December meeting. As if market disapproval didn’t put enough pressure on the Fed to reconsider this hike, President Trump said in a November interview that he was “not even a little bit happy” with Chairman Powell. Perhaps seeking to amend for his October offense, more to the markets than to the President, Powell told the Economics Club of New York on November 28th that he now saw the current interest rate level “just below” neutral, implying fewer rate hikes were coming. The S&P 500 rose 2.3% on the day.
On the first day of the Fed’s December Federal Open Market Committee (FOMC) meeting, the President tweeted, “I hope the people over at the Fed will read today’s Wall Street Journal Editorial before they make another mistake… Stop with the 50 B’s. Feel the market, don’t just go by meaningless numbers.”
Allow us to explain the reference to “50 B’s.” The Fed decided several years ago that when it came to reversing its monetary easing of 2007-2014 it would both raise interest rates and allow its bond portfolio to run-off (quantitative tightening or QT) at more or less the same time. However, rather than fine tuning monetary policy with both levers at each FOMC meeting, Fed officials decided to leave one —QT— on “autopilot” to operate in the background, while public communications would focus on interest rate policy. The Fed’s plan, laid out by former Chairperson Janet Yellen’s board, was to gradually ratchet up the amount of bonds that would mature off the Fed’s balance sheet without being replaced each quarter. This program started in October 2017 at up to $10 billion of bonds per month, with the monthly limit increasing by $10 billion each quarter, until it reached $50 billion per month (the “50 B’s”) in the fourth quarter of 2018. The Fed doesn’t necessarily meet its monthly limit if the requisite amount of bonds on its balance sheet aren’t maturing in any given month. Recently, the Fed’s bond maturities have been averaging closer to $40 billion per month. The balance sheet reduction program is expected to stay at a maximum of $50 billion per month or $600 billion a year for the foreseeable future. Chair Yellen had said letting the bonds mature off the Fed’s balance sheet would be like “watching paint dry.”[iv]
On December 19th, the Fed delivered its long expected ninth rate hike of the cycle, raising the Fed funds rate by 0.25 percentage points to a target range of 2.25%-2.50%. The good news was supposed to be that the Fed committee members foresaw only two additional rate hikes in 2019, down from three previously, and that they cut their expectation for what constitutes a long-term neutral interest rate. But Powell reiterated the Fed’s QT policy, suggesting the QT program of allowing up to $50 billion in bonds to roll off its balance sheet each month would remain on autopilot. He further referred to the amount that had already run-off, some $365 billion to date, as “pretty small.”[v] Over the next four trading days, the S&P 500 Index fell 7.7% and the 10-year Treasury yield fell 0.08 percentage points to 2.74%. In all, the stock market fell 19.8% peak-to-trough from September 20th through December 24th.
By the next time Powell spoke, on January 4th, he had revised his thinking: “If we came to view the balance sheet normalization plan was part of the problem, we wouldn’t hesitate to make that change.”[vi] The S&P 500 rallied 5.6% over the next four days in the new year. Contributing to the rally, a very strong US unemployment report and a bank reserve requirement cut in China were announced the same day. In Powell’s next speech, on January 10th, he said the Fed’s balance sheet in the future, “will be substantially smaller than it is now.”[vii] The stock market dipped intraday immediately following this comment, but still finished up on the day. This dialog between the Fed and the market looks to carry further into 2019.
The stock market can be an important early indicator of financial and economic conditions, but it isn’t always right. Nobel Prize-winning economist Paul Samuelson once quipped “The stock market has predicted 9 out of the last 5 recessions.” But to look at the market as a prediction tool is to downplay its interactive role with the economy and policy. Market signals allow authorities to identify and respond to various issues in order to avoid adverse outcomes. The Fed was probably right to be tightening when the stock market was ahead 10.6% for the year. After the stock market’s -13.5% quarter, QT didn’t look as wise. That means as the market rallies, the Fed may revert to its tightening script.
Will tight monetary policy drive the US economy into recession if the Fed doesn’t relax its expectations for monetary policy? We don’t expect to find out in the near term. We believe the Fed, in addition to considering classical economic factors, will continue to be responsive to the markets, and the markets will guide the Fed constructively. Then again, the Fed needs to be wary that its responsiveness doesn’t drive the stock market into overvalued territory, something which could happen if it were solely focused on following market movements. The Fed generally has been more responsive to markets since Alan Greenspan took the helm of the Federal Reserve in 1987, and on average the stock market has traded at a higher valuation since then. Despite two noteworthy equity bubbles within the past twenty years, recessions have also been less frequent since the Fed has been more responsive to market conditions.
Rate Hikes in 1994
The rising rate environment of 2018 had similarities to that of 1994. With the economy still recovering from the recession of 1990-1991, the Fed decided in 1994 that the economy was strong enough to withstand tighter monetary conditions. At the beginning of 1994, US real GDP was growing at 5.6%, inflation was 2.6%, and the 10-year Treasury yielded 5.8%. Unemployment was 6.5%. President Clinton had just imposed steel tariffs.
From a Fed Funds rate of 3.0% at the beginning of the year, and without prior warning, the Fed raised rates 0.25 percentage points in each February, March, and April, followed by a 0.50 percentage point increase in May. The Fed continued to raise the rates, moving the Fed funds rate to 5.5% by yearend 1994, and then to 6.0% by March 1995. There was no QT program at the time. The 10-year US Treasury moved from 5.8% at the beginning of the year to 8.0% by November. Mortgage rates followed and home sales consequently slowed.
The S&P 500 fell 7.6% in point value from its February high to its December low, bottoming once participants realized the Fed had began to slow the rate of interest rate increases.[viii] For the full calendar year, the S&P returned 0.9% including dividends.
The yield curve, as represented by the 10-year Treasury yield minus the 2-year Treasury yield, started the year at 1.58 percentage points, and got as narrow as 7 basis points (0.07 percentage points) at one point. US real GDP growth slowed to 1.4% in the first quarter of 1995, but as the economy and the markets stabilized, the yield curve expanded back to 0.50 percentage points. And more importantly, the economy reaccelerated, generating strong growth through the end of the decade. Trade tensions continued into 1995, with President Bill Clinton threatening to impose 100% tariffs on certain models of Japanese cars.[ix] The first of two government shutdowns under President Bill Clinton’s administration didn’t start until November 1995.
In the present case, the Fed has bumped its Fed funds rate up 9 times beginning in 2015, to 2.25-2.50% currently. The 10-year Treasury began 2018 yielding 2.41% and moved as high as 3.23% in November before finishing the year at 2.68%. Despite the comparisons on a number of levels, the stock market reacted far more negatively in 2018. The interest rate swing was far greater in 1994, and yet the stock market sell-off was less than half as much. The 1994 comparison lends credence to the idea that investors over-reacted in 2018, and that the subsequent resetting of expectations and risk tolerances could be setting the economy up to experience several more years of decent growth.
Fiscal Pressures
While investors are concerned about quantitative tightening (QT), we should consider QT within the broader context of supply and demand for bonds, particularly US Treasuries. Under QT, the Fed is allowing up to $50 billion of bonds per month, or up to $600 billion per year, including both Treasuries and mortgage-backed securities, to mature, rolling off its balance sheet. Assuming these bonds need to be refunded, the Fed’s maturities contribute to the broader supply of debt that needs to be funded by public investors. The bigger and more important source of new US Treasury supply comes from the US Treasury Department itself, because the Government runs chronic deficits. The Federal deficit in FY18 (September yearend) was $804 billion, up from $665 billion in FY17, and is expected to be $981 billion in FY19.[x] National debt is officially 78% of GDP and rising. It is noteworthy that the new supply of Treasuries issued by the Treasury Department each year is in fact greater than the official deficit.
Bear in mind that from 2009-2014, quantitative easing (QE) was intermittently in effect, buying up to $80 billion of bonds per month at its peak, and to a meaningful extent offsetting the Treasury Department’s issuance of new debt. With the advent of QT which has been ramping up since October 2017, the Fed and the Treasury have both been contributing to the supply of bonds available to the public. Supply pressures for Treasuries may be complemented by diminished demand from some of the most prominent buyers of US Treasuries. Given the trade war, China’s central bank may be interested in further diversifying its foreign exchange holdings away from US Dollar-denominated securities. Furthermore, with oil prices down, Saudi Arabia will be buying fewer Treasuries.
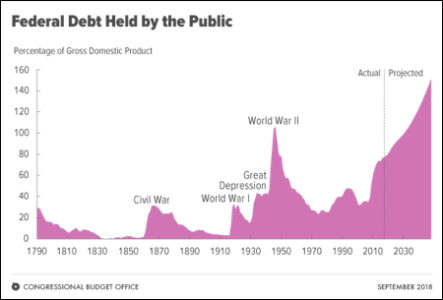
The accompanying chart indicates we are facing debt levels unprecedented during our peacetime history. Despite staring at deficits in the proximity of a trillion dollars per year for the next several years, bond investors are keeping interest rates at what we perceive to be fairly low levels, around 2.68% on the 10-year Treasury. Low rates suggest bond investors are not worried about the growing supply of US Government debt. We would expect bond investors to be fairly attune to these matters, and in fact federal deficits haven’t had a significant impact on rates historically. Deficits have tended to run larger during periods of economic weakness, when demand for bonds is relatively high. The prospect of a weaker economy tends to drive investors towards the safety of bonds, thereby keeping rates low. Japan’s pedestrian economic growth for thirty years has kept their interest rates even lower than ours. It would appear that the supply isn’t as important a factor in the pricing of Government bonds as is the prospects for a nation’s growth. With government debt at 236% of GDP at the end of 2017, the Japanese example suggests the US could continue to increase its national debt for quite awhile. A generally downbeat assessment of economic prospects may be necessary to keep Government funding viable at low rates, and the current political climate in the US does not lend confidence that we will proactively address our fiscal problems.
Conclusion
The stock market and economic statistics from the US are telling two different stories. While the economy appears strong, the markets seem to be obsessed with a potential economic downturn. The Fed’s policy communications and the market’s reaction to those communications are driving market volatility at present. Although the stock market should not be the final arbiter of policy, it often provides instructive guidance to policy which benefits the broader economy. There are, as always, other reasons for concern. Market tremors can undermine confidence, and any of the current headline issues could erupt into larger problems. But the most likely path is that we resolve our policy challenges and manage our monetary policy responsibly.
Stock market volatility is likely to persist, but widespread pessimism doesn’t necessarily mean the market trend lower. If investors continue anticipating the next recession, the stock market could well continue to trade at a discount to its long-term average price-to-earnings ratio until a recession arrives. On the other hand, improving economic growth in the face of an anticipated recession could well drive stocks higher. In this mature phase of the business cycle, we recommend clients remain invested in high quality US stocks. While being conscientious of the tax consequences, we are inclined to add to high quality positions on weakness and to sell oversized positions into strength. Clients should also maintain cash levels sufficient to meet their near-term spending needs.
[i] Nunn, Sharon, “Many US Financial Officers Think a Recession Will Hit Next Year,” WSJ, 12/12/18.
[ii] Torry, Harriet, “Economists See U.S. Recession Risk Rising, WSJ, 1/10/19.
[iii] PBS, Q&A session with Judy Woodruff, 10/3/18.
[iv] Anstey, Chris, “Markets Signal 2019 Focus Will Be Fed’s Balance-Sheet Unwind, Bloomberg, 12/19/18.
[v] www.federalreserve.gov, Federal Open Market Committee, December 18-19, 2018 FOMC Meeting Press Conference Transcript.
[vi] Franck, Thomas, “Powell says Fed ‘wouldn’t hesitate’ to tweak balance sheet reduction if it was causing problems”, CNBC, 1/4/19.
[vii] Chen, Vivien Lou, “Wall Street Is Divided on Impact of Fed’s Balance-Sheet Run,” Bloomberg, 1/14/19.
[viii] Santoli, Michael, “To make the bullish case for 2019, Wall Street looks to the mid 90s,” CNBC, 12/3/18.
[ix] Watts, William, “How the stock market’s performance ‘rhymes’ with 1994 in one chart,” Marketwatch.com, 12/17/18.
[x] Congressional Budget Office (CBO), The Budget and Economic Outlook: 2018 to 2029, April 2018.