Fall 2019

—Robert B. Sanders, Senior Vice President, Portfolio Manager
Investors like data and particularly the predictability of data. In fundamental investment analysis, company and economic data are the signal that is useful for modeling future expected economic growth rates, revenue, earnings, cash flows, etc. We use these to determine future values that can be discounted back to a fair value today. This helps us decide if something is currently cheap or expensive relative to future expectations, and importantly, what are we buying, holding or selling for our clients’ portfolios. Unplanned economic and political events can affect our economic decision making but they are mostly noise around a signal.
This noise can have an immediate impact on prices, which may cause a change to the model, but in many cases, it is a futile endeavor to try to model unpredictable events. So far this year, equity investors have done a good job of separating the signal from the noise, focusing on quantifiable risks, results and outlooks, with new market highs as the reward.
Economic risks continued to wax and wane in many forms this past quarter to threaten this year’s high returns. Headlines provided hope and worry on any given day about the trade war with China, the Saudi Arabian oil production facility attack in mid-September, a deal/no-deal Brexit from the EU, and impeachment politics begun in September, among others. A Chinese/US trade deal still has glimmers of hope as both sides continue to express a desire to do a deal. West Texas Crude oil prices spiked up to $63 on news of Saudi oil attack, but returned to the mid-$50s by end of September, shaking off worries of Saudi Arabian oil production disruption rather quickly. The United Kingdom has again postponed its Brexit timing with the blessing of the European Union, as Prime Minister Boris Johnson cannot seem to get a deal through Parliament quickly. In the US, the partisan-aligned impeachment inquiry enters the public phase of hearings, but does not seem to worry the markets in the least. With the next US presidential election still a year away, corporate America seems more concerned with some of the policies being floated by current Democratic candidates than with a continuation of policies by the current administration. All in, equity prices have shown a remarkable ability to shake off geopolitical risks in rather quick fashion, perhaps reflecting a collective sentiment that these risks will resolve in due time without seriously impacting projected earnings. Daily volatility in the markets might prompt one to presume that investors are overreacting to headline news. However, year-to-date investment returns this year imply investors are systematically dismissing the headlines as noise. More importantly, what signals are investors focused upon to drive equity prices to the latest all-time highs?
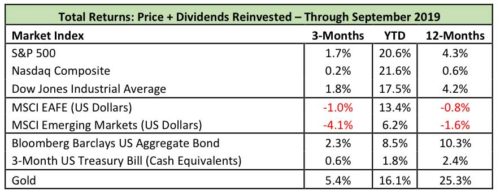
Market Returns Through September 30th
To begin, the equity markets were volatile but incrementally positive for the third quarter, following on a strong year-to-date through June that pumped the S&P 500 index up 18.5%. The 1.7% total return of the index for Q3 brought the year-to-date return up to 20.6%. On a one-year basis, the total return is only 4.3%, as it includes the dreadful fourth quarter 2018 price decline of 14 percent. The technology-heavy Nasdaq Composite Index gained only 0.2% in Q3, but has notched a better return than the S&P 500 year-to-date of 21.6%. However, the Nasdaq index is only barely getting its nose above water on a one-year basis at 0.6%. All in, the US equity markets are providing solid returns for investors in 2019, more than recovering from fourth quarter 2018 losses, as market indexes again dance around all-time highs.
With US earnings growth attractive relative to Europe and Japan, modest but positive consumer-driven GDP growth, equity dividend yields competitive with bond yields, and tailwinds from share buybacks, the US equity markets remain an attractive haven for investable assets. The US equity markets continue to outpace foreign returns in 2019. Returns from international developed markets represented by the MSCI Europe Australasia Far East Index (EAFE) were negative in Q3 (-1.0%) but positive year-to-date at 13.4%. The MSCI Emerging Markets Index, dominated by returns from China, Korea, Taiwan, and India (66.5% weight), lost ground in the quarter down -4.1%, but still notched a positive year-to-date return of 6.2%. Both the EAFE and emerging markets indexes are slightly negative on a 12-month basis at -0.8% and -1.6%, respectively.
Fixed income markets have been holding up well in 2019, having their best year since the tech bubble burst from 2000 to 2002, as measured by the Bloomberg Barclays US Aggregate Bond Index. Prompted in part by the yield curve inversion begun in March and the renewed recession fears it spawned, investors took some profits in equities and reallocated them to bonds in a “risk-off” trade this year to hedge a downturn in the economy. While the inverted yield curve has historically been a good predictor of a recession, it is not usually an immediate threat, with recessions beginning one to two years after the inversion. Two interest rate cuts in the quarter (July and September) and a third in October, also buoyed bond prices that seem to have been predicting the cuts all year. Finally, gold has historically been a store of value in risky markets. The precious metal commodity is also having its best year since 2010, with prices appreciating 5.4% in the quarter and 16.1% year-to-date.
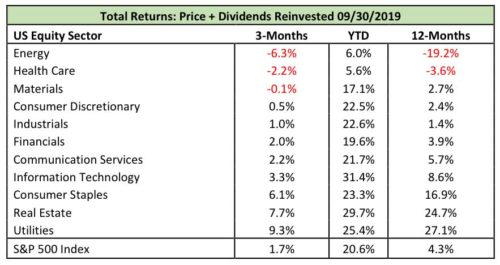
US equity sector returns for the quarter were mixed, with the Energy, Health Care and Materials sectors posting negative total returns of -6.3%, -2.2% and -0.1%, respectively. Energy and Health Care have been the clear laggards year-to-date with low single-digit positive returns of +6.0% and +5.6%, respectively. Energy stocks are battered by over-supply of oil and natural gas relative to demand, pressuring prices. Low oil prices are good inputs for energy-dependent industries but tough on the explorers, producers and suppliers. The Health Care sector is struggling with the overhang caused by bi-partisan pre-election posturing that puts drug prices, procedures and technologies in the political cross-hairs of price controls and regulation. Leading sectors for the quarter were Utilities (+9.3%), Real Estate (+7.7%) and Consumer Staples (+6.1%), rewarding defensive sector allocations by investors. These sectors also held up best in the fourth quarter market swoon of 2018, generating the best 12-month returns of the group. Information Technology has had the highest return among the sectors year-to-date at +31.4%. Growth-oriented investors still favor these names in an increasingly crowded trade.
 —
—
Strong Economic Signals
The Organization for Economic Co-operation and Development (OECD) has forecast global Real GDP growth to decline from 3.6% in 2018 to 2.9% in 2019 and 3% in 2020, factoring in disruptions to supply chains from the US-China trade war, and weakening demand as consumers and businesses hedge against a downturn.[1] The US economy is projected to slow in parallel, from 2.9% growth in 2018, to 2.4% in 2019 and 2% in 2020. Yet the US remains one of the higher growing economies among developed nations. Weaker outlooks for Europe and Japan weigh heavily on global growth. Europe’s growth is projected to decline from 1.9% last year to 1.1% and 1.0% in 2019 and 2020, respectively. Japan’s GDP growth is projected to slow from 0.9% in 2019 to 0.5% next year.[2]
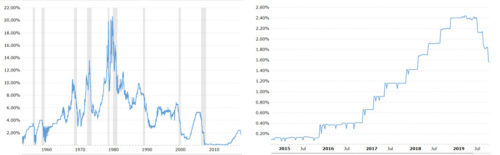
US GDP growth has declined along with a global slowdown. Weak business spending and investment, and negative earnings impacts from the China trade war are weighing on otherwise positive US economic results including low unemployment, moderate wage growth, and consumer spending. The Federal Reserve Board of Governors has attempted to stimulate growth with two 25-basis point Federal Funds target rate cuts in the third quarter (July and September) with language stating they will “…act as appropriate to sustain the expansion…”[3] With a third “insurance” rate cut on October 30th, the target range for the Federal Funds rate is now 1.5% to 1.75%. These were the first cuts since it began raising rates in December 2015, and the first cut in rates since December 2008. With this third cut, the Fed has signaled a pause in rates at current levels. The US equity markets seem satisfied for now with the progress the Fed has made and the accommodative stance it has taken thus far in 2019. Investors seem reassured by the predictability of the Fed’s approach to counter some of the worrisome noise and steady the economic outlook.
Federal Funds Rate[4] Federal Funds Rate: Last 5 Years[4]
The European Central Bank cut its interest rates to -0.5%, the lowest level ever, and launched another round of quantitative easing with plans to purchase 20 billion Euro of bonds per month beginning in November in hopes of providing economic stimulus to that region. There is an increasing call from developed markets abroad for governments to invest in infrastructure projects to stimulate economies and consumer demand by providing jobs. It is hard to gauge whether that spending and other central bank policies will have long term positive effects or simply keep the economies from slipping further.
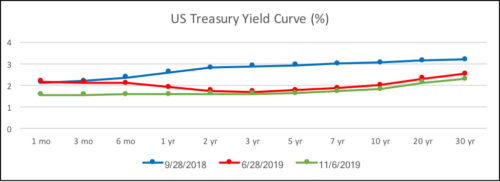
The US Treasury yield curve inversion (higher short-term rates than long-term rates) that began in March is beginning to normalize. With the third Federal Funds Rate cut a slightly positive slope has returned to the Treasury curve. The difference in yield between the shortest, one-month Treasury bill and longest, 30-year Treasury bond is now only 78 basis points (0.78%). This implies investors have low expectations for inflation in the future. It also makes investing in longer-term bonds less attractive as one is not compensated for taking on the risk of holding the longer maturities. The spread between what banks pay for interest on short term deposits and receive for lending at long term rates that are higher is known as the Net Interest Margin – a key metric in evaluating the results and prospects for many financial firms. These thin margins make it difficult for financial firms to earn reasonable returns on many of their products. As the curve steepens, financial sector stocks become more attractive. With the current state of the yield curve, financial firms are relatively cheap, and one is not getting compensated to take any duration risk beyond the shortest bond maturities.
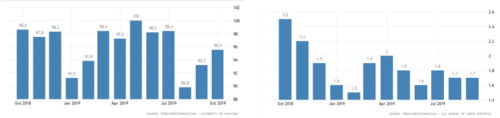
The unemployment rate remains around 50-year lows though the chart below would indicate that when it turns it turns quickly. Not surprisingly, low unemployment has led to some wage inflation due to the scarcity of available workers, with the year-over-year increase averaging 3.6% for the third quarter of 2019. This is positive for consumer spending and reinforces the current consumer sentiment index which hit 95.5 in October. This index has average 86.62 points from 1952 to 2019, and indicates consumer opinions on the outlook for the economy and willingness to spend. Inflation also remains sedate with the most recent annual numbers coming in at 1.7% for September, no change from August, and within the Fed’s long run target rate of 2%. All of these seem to support a continuation of current economic activity and support for the market.
Unemployment[5] Wage growth[6]
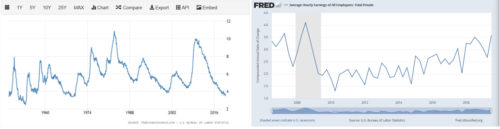
U. Mich. Consumer Sentiment[7] US Inflation Rate[8]
 —
—
But Is Valuation Too High?
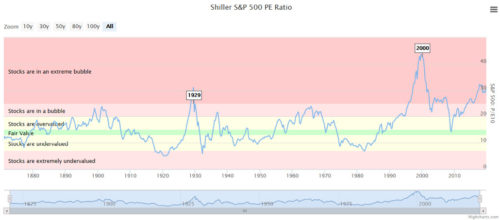
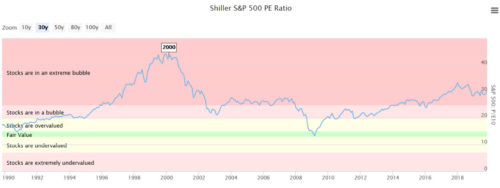
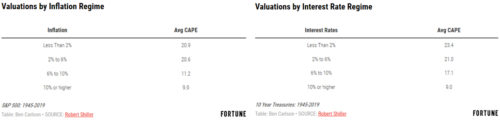
Corporate earnings have been mostly resilient through the third quarter, despite the China trade tariffs. The consensus earnings outlook for 2020 is growth of 9.6% for the S&P 500 Index. On a price to forward earnings basis the S&P 500 Index is trading at 17.5x 12-month forward P/E, above the 20-year average of 15.8. On a trailing basis, the Cyclically Adjusted Price Earnings Ratio (CAPE Ratio), alternatively known as the Shiller P/E ratio named for Yale Professor Robert Shiller, provides another look at valuation of the market relative to history. This metric divides the current price by the average inflation adjusted earnings of the prior ten years. This measure has proven some level of predictability when back-tested to the year 1870. Over just the past thirty years, the CAPE ratio for the S&P 500 Index indicates the market has been and remains in an over-valued, even bubble or extreme bubble, state for most of that period. With a low inflation rate and low interest rate environment supporting investment, borrowing and spending, perhaps stocks are less over-valued than history would indicate – a “new normal” may be appropriate while these conditions last. Yet, a CAPE ratio near 30x still seems a bit inflated even in this environment. With markets hitting new highs, taking some profits on overweight allocations to rebalance is not a bad strategy.
 [9]
[9]
 [9]
[9]
 [10]s
[10]s
Final Thoughts on Signals and Noise
With the current backdrop of economic stimulus, elevated valuations, slowing but positive growth, low interest rates, and low inflation, one might question if the status quo will continue and for how long. The US economy appears to remain on solid footing. The Fed is doing its best to keep the economy from falling into recession or overheating. Earnings growth has had a boost from share buybacks that have been accelerating since the Trump tax cuts were enacted. Low interest rates continue to provide cheap debt to companies willing to borrow to repurchase shares. Current estimates are that corporations buying back their own shares have added roughly 2% to reported earnings growth rates in recent quarters. When interest rates rise, the buyback “punch bowl” gets taken away, and a more sober and true earnings growth rate will likely support lower average valuations than we have today.
China and the US seem interested in resolving the current trade dispute, but that will likely take some time to sort out. Brexit will play out. Impeachment results are unpredictable. Of bigger concern is the outcome of the next presidential election cycle. Republicans tend to favor programs that support businesses and investors. It is generally assumed that a change of administration to a Democratic party candidate will prompt higher individual and corporate tax rates, regulation of health care costs, but perhaps bring a deal for domestic infrastructure spending, a national minimum wage, and potentially reduced geopolitical risk – perhaps more signals, less noise. While history cannot be relied upon for future results, historically election years bring positive market action. In the twenty-three election years since 1928 only four have had negative returns. This is an interesting statistic but not something upon which one should make an investment decision.
Taken as a whole, we continue to be constructive on equity market returns. We invest in what we believe are good stocks for the future, and that will generally perform better over a full market cycle. The uncertainty around the future, however, requires prudent investors to control the things that they can control. Asset allocation is a controllable lever. Investors should not risk assets in the stock market that are earmarked for cash needs in the next one to two years. Proactive discussions with your advisor about your financial needs and plans as they change allow timely adjustments to portfolios as needed, and peace of mind that your financial affairs are being prudently managed. This may be the best way to cancel the daily noise and focus on the future.
[1] Organization for Economic Co-operation and Development, “Interim Economic Outlook”, 9/19/2019.
[2] International Monetary Fund, “World Economic Outlook”, October 2019.
[3] Board of Governors Federal Reserve System, press releases 7/31/19, 9/18/19, 10/30/19.
[4] US Department of Labor, Bureau of Labor Statistics
[5] Trading Economics.com, US Department of Labor Bureau of Labor Statistics
[6] Federal Reserve Bank of St. Louis – US Department of Labor Bureau of Labor Statistics
[7] Trading Economics.com, University of Michigan
[8] Trading Economics.com, US Department of Labor Bureau of Labor Statistics
[9] Longtermtrends.com, Highcharts.com, Quandl.com, “Shiller PE Ratio by Month”
[10] “Yes stocks are overvalued. But by how much? Here’s what history tells us”, Ben Carlson, Robert Shiller, Fortune.com July 31, 2019