Woodstock Quarterly Newsletter / Q4 2018

Hope is Not a Strategy
The S&P 500 Index was volatile in the first half of the year through June, and tallied returns that were a little better than break-even at the mid-year mark, +2.6%. The Dow Jones Industrial Average (DJIA) was slightly negative at -0.72%, and the tech-heavy NASDAQ Composite Index was the mid-point winner, up a strong 9.36%. In the third quarter markets accelerated in July and August before slowing in September.
The positive results year-to-date through September 30th were a +10.6% return for the S&P 500 Index, +8.8% for the DJIA, and the NASDAQ up an impressive +17.5%. With that quarter behind us, it had appeared to be shaping up for a pretty good year in the markets. However, October brought a market slide that erased the year-to-date gains as we entered November. While we had already experienced a similar pull back in February, volatility in a bull market run this long should be expected. Fundamentally we are long-term investors in the stock market and so we tend to look at these market dips as buying opportunities. Experience suggests that our clients will be rewarded over the long term by not panicking on the dips and having the patience to stay invested. Having and sticking with a long-term investment plan, that takes into consideration your tolerance for risk, cashflow needs, time horizon and return objectives is the best defense against these short-term market fluctuations, making it easier to “stay the course.”
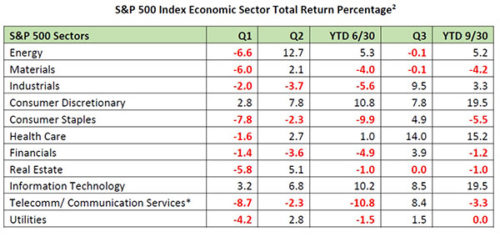
As mentioned in our summer newsletter, a handful of stocks had accounted for 99% of the modest gain in the S&P 500 at mid-year.[1] The so-called “FAANG stocks”, Facebook, Amazon, Apple, Netflix, and Google (Alphabet), and Microsoft drove those returns. This isn’t unusual for a market capitalization weighted index in which the heavier weighted stocks have a larger impact, but it does make the market index a misleading indicator of returns for the average investor. The worry that a market gain concentrated in few stocks might herald the end of the bull market prompts one to look deeper at the breadth of market gains. Of the 11 economic sectors in the S&P 500 Index, only 4 were in positive territory through June (measured by price only): Consumer Discretionary +10.8%, Information Technology +10.2%, Energy +5.3%, and (marginally) Health Care +1.0%. However, the third quarter market performance was more balanced among sectors with eight of eleven sectors in positive territory, and the remaining three essentially flat.
Through September, the biggest mid-year sector winners, Technology and Consumer Discretionary, continued to rise, while Healthcare made a dramatic run up, Industrials moved into positive territory, and the rest pared their losses. You will see in the table below that it had not been a case of “a rising tide lifting all boats” early this year, but more sectors were “in the black” after the third quarter. When a market is rising on just a few stocks or sectors, there is a higher likelihood that the market is running out of steam. A look at the positive performance of the S&P 500 Equal-Weighted Index through September (+5.76%) shows the market breadth was not just concentrated in these FAANG names. A more broad-based rise in the market is more supportive of the probability of continuing forward progress than one driven by a handful of high fliers. It certainly gives investors a more comfortable outlook.
Rounding out the performance summary, international markets have not held up as well as the U.S. year-to-date when converted into the strong U.S. dollar relative to other currencies. The developed foreign markets, represented by the MSCI Europe, Australasia, Far East Index (EAFE) returned -1% through September. The MSCI Emerging Markets Index was off -7.4% over the same period. In local currency terms, most developed market indexes were modestly positive, while emerging markets results were mixed. On the fixed income side of the ledger, shorter maturity bonds outperformed longer maturities. One would expect this in a rising rate environment. Through September, 2-year U.S. Treasury bonds were slightly positive, +0.2%, 5-year Treasuries lost -1.3%, 10-year Treasuries were down -3.7%, and 30- year Treasuries were off -6.6%. Investment grade U.S. corporate bonds of various durations lost -2.2% on average. For those that own the commodity, gold has been no safe haven, down -10.3% through Q3.

There is a phrase attributed to poet Samuel Johnson in 1791, and later famously adopted by Oscar Wilde, characterizing second marriages as “the triumph of hope over experience.” I think the phrase could well be applied to many circumstances in life, but pertinent in this case as the triumph of optimism by investors as the U.S. stock market continued marching forward through September on course for a nine-and-a-half-year-long bull market, the longest in history. October’s stock market volatility proved there is also a fair amount of fear by investors that the bull market may be near its end. At odds are two behavioral biases: trend following, where one assumes the current trend will continue indefinitely, and the gambler’s fallacy, or betting on a trend reversal. The trouble with both approaches is correctly guessing how long a trend will run, when it will reverse, and hoping you are right. In our experience, setting an appropriate asset allocation that allows a client to stay invested through the ups and downs averts the need to try to time the market changes. As the saying goes, hope is not a strategy.
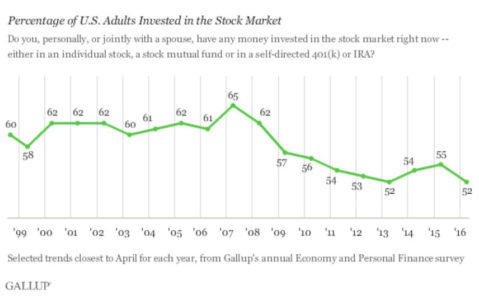
Considering the optimism of investors and the apparent fragility of that state, there are some interesting statistics on the current investor pool. For investors that own stocks, the allocation to stocks among other investment options including cash and bonds is near the fifteen year high of roughly 70%.[3] The only time it was higher in the past 30 years was at the peak in 1999 when stock allocations hit roughly 77%. Allocations to bonds and cash are nearly identical today, in the mid-teens as percentages. This allocation to stocks would imply a high level of optimism among stock investors that the bull market trend will continue. It also may mean that with the run up we have enjoyed, many of these investors have not rebalanced their portfolios in line with their objectives. Avoiding capital gains taxes may be one reason for this. Curiously, a concurrent statistic shows of all adult Americans, investments in stock as an asset class is near a twenty-year low, only 55% according to the latest Gallup survey.[4]
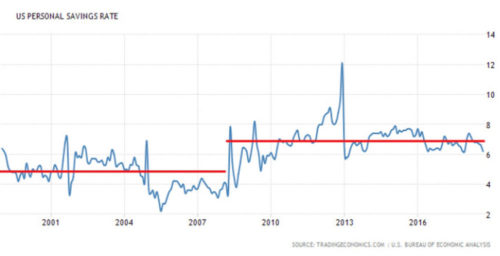
The disconnect highlights that investors that own stock continue to own a historically bullish weight in the asset, while simultaneously fewer people in general are invested in the stock market. From 1999 through 2008, the percentage of U.S. adults invested in the stock market was in the low to mid 60% range, and has been falling to the low to mid 50% range since 2008. This was likely a reaction to the market collapse in 2008. At the same time, the U.S. Household Savings Rate has been in a remarkably steady range averaging just under 7% since 2008, an increase from just under 5% in the preceding decade.[5] Perhaps this is also a movement toward safety since the 2008 recession, coinciding with the aging demographics of the Baby Boomer generation. Would this second statistic imply that American confidence in the economy, the means to invest, and confidence in stocks as a safe place to invest have all diminished since the great recession, despite witnessing one of the longest bull markets in history? One result of these trends may be that a large segment of the population has missed out on a period of not just wealth recovery but great wealth creation begun at the market bottom in March 2009.


At Woodstock we have historically been at the higher end of stock allocations relative to the national averages, while being attentive to our clients’ investment objectives, because we believe stocks provide the best potential long-term return. The fundamental factors underpinning the economy and stock market run continue to be strong. By many measures: corporate earnings, GDP growth, unemployment, and inflation, to pick a few, one would conclude the economic backdrop is on solid footing. While this data is often reported a month or more after the fact, a delay that impedes real-time decision making, markets tend to look ahead and discount future results long before they come to pass. This foresight, whether correct, misguided or early, impacts the markets daily. This fine-tuning of an outlook is as often triggered by fear and greed as by factual data. Lately optimism and pessimism about the future have turned on a dime without much more than a whisper from the “animal spirits” at a time when there are plenty of tangible signals to point toward and everyone is looking at the same things. The current bull market began to crawl out of the last recession with similar intuition, which wasn’t apparent in the moment but obvious with hindsight. Perhaps then hope had been spurred by recent government stimulus programs, or Former Fed Chairman Ben Bernanke’s “green shoots” speech in early March that year, but tangible economic data had yet to materialize to support it. And yet that market collapse finally reversed, envisioning better times ahead. In October this year expectations of rising interest rates, souring trade relations with China, expectations of slower earnings growth next year, and more than a few high stock valuations (none of which was fresh news) caused enough collective anxiety to push the S&P 500 Index down over 11%. Hope about the future of the market was quickly replaced by fear that the party was over. It is still too early to tell if this is the beginning of a bigger change in market direction.
Whether optimist or pessimist, how are we to think about what comes next? Let’s look at what we know. Sir Isaac Newton once said “what goes up must come down”. He was of course referring to gravity, but the idiom (and its inverse) applies here in that most things moderate over time to a natural state, which we assume to be the average over time. In the investing world we call this “mean reversion”, which applies to growth rates, valuations, economic data, etc. The eternal question is “when will something mean revert?” From our experience we would expect that interest rates, unemployment and inflation cannot remain so low forever, and when they rise, they will put a damper on our growth. Remember, however, that interest rates took 40 years to get so low; these things can take some time. Earnings growth and profit margins are high and these rising cost pressures should bring these measures back toward long-run averages. As that happens, the market that has run so high should pull back. The problem remains in the timing. While the overall economic outlook for the coming two years appears hopeful, there are a few readings of the economic tea leaves that suggest we may be due for a recession before long. The market correction in October indicates a number of investors are wary of the future and ready to head for the exits, and that the market is beginning to discount a different future. This long upward trend has been anchored to an environment of cheap credit, strong earnings, low inflation and low unemployment. What is the stability of these anchors, and are they beginning to weaken?
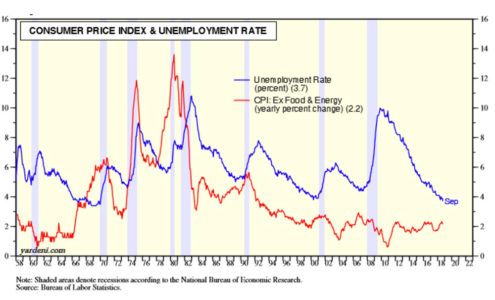
The U.S. Unemployment rate was released by the Labor Department for September, falling to 3.7%, a level not reached since 1969.[6] One glance at the chart below tells you that Sir Isaac’s theory was at work, and we have been the beneficiaries of that pattern, but the reverse could also come to pass. The pace of growth has averaged 208,000 jobs per month year to date, up from an average of 182,000 last year. Average hourly pay rose 2.8% year over year. As average wages rise along with inflation, job growth will more than likely slow. The relationship between unemployment rates and inflation is known as the Phillips Curve. It is an inverse relationship as you might expect – as the level of unemployment drops, workers become scarce and employers compete for workers by raising wages. This in turn contributes to inflation. However recent remarks by the current Chairman of the Federal Reserve, Jerome Powell, indicate the Fed expects the unemployment rate to remain below 4 percent, and inflation to stay very near the Federal Open Market Committee (FOMC) target rate of 2 percent.[7] In fact, he says forecasts by FOMC participants, the Survey of Professional Forecasters, and the Congressional Budget Office all expect these two metrics to remain in similar ranges through the end of 2020. Looking at the pattern of the blue line in the chart below that indicates the unemployment rate, one would expect that rate to begin rising before long.[8] It is also expected that the Fed will continue to raise its Federal Funds rate by 0.25 percentage points in December this year, and another three or four 0.25 percentage point rate hikes next year. There are many who are beginning to suggest that the Fed’s plan is too aggressive considering current economic conditions, and would like the Fed to slow down to allow more unrestricted growth. The Federal Reserve must also balance the pace of rate hikes against a desire to have more solutions at its disposal when the next recession hits.
Despite strong earnings, low inflation and unemployment near fifty-year lows, fears of global trade protectionism and tariff wars have caused the International Monetary Fund (IMF) to reduce its forecast of global growth for next year by 0.2% from previous forecasts.[9] They are now forecasting global growth in 2019 that has “plateaued” relative to growth in 2017 and 2018 at 3.7%. This is reasonably solid growth, even though it is not accelerating. While growth rates in the developed world are rather anemic in spots, the emerging economies, dominated by China, India, Russia, and Latin America, have a collectively higher growth rate than the rest of the world. This growth is also predicted by the IMF to be flat over the coming year versus 2017 and 2018 at 4.7%. Despite the successful completion of as yet to be ratified trade negotiations with Mexico and Canada, the forecast impact on Chinese and U.S. economies from the unresolved trade war between these countries is meaningful. Similar but less pronounced are the projected impacts of the Brexit trade negotiations between the European Union and the United Kingdom. GDP growth in the U.S. in particular is expected to slow from 2018 to 2019. The bump received from the Trump tax cuts provided some fuel for U.S. GDP growth in 2018, projected now to reach 2.9%, but is expected to revert toward a more measured pace of 2.5% in 2019.

Market angst about the mid-term elections in the United States has moderated. The results rebalance the Republican-dominated executive and legislative branches, with Republicans retaining control of the Senate, and Democrats taking control of the House of Representatives. This swing back toward a balance of power between the parties creates a bit of a legislative stalemate, allowing the economic programs currently in place to continue. It may facilitate a future bi-partisan infrastructure spending bill, while providing a check and balance on the Republican and Democrat agendas. Some level of legislative gridlock will likely leave the Trump tax cuts and federal deregulation in place. Bi-partisan measures to regulate drug prices may move forward, but modifications to Obamacare will likely be limited. Investors cheered the election news, buoying markets temporarily as “mid-term” uncertainty subsided.
Risks to continued earnings growth include rising wages driven by competition for scarce workers in a low unemployment environment, increasing costs from trade wars, tightening U.S. monetary policy driving up borrowing costs, and inflation. Higher costs will curtail some investment and raise prices for consumers, slowing demand and weighing on corporate margins. How soon and how strong the impact of these forces on the markets will be is hard to say. What we know from experience is it is as difficult to time getting out of a market as it is getting in, and certainly harder still to get the timing right for both. According to investment research firm Morningstar, missing just the ten best trading days of 5,217 days in the market from 1997 to 2017 would reduce by more than half the average annual returns over that period.[10] We recommend staying invested for the long term in each client’s specific asset allocation with prudent investments in high quality securities. We believe this strategy has the best prospects for achieving our clients’ goals through a market cycle, and it bears repeating, to stay the course.
At Woodstock, we believe that the stock market provides the best opportunity for investors to grow and preserve their assets relative to the returns of bonds and cash against inflation over the long term. If you have questions about themes raised in this article as it relates to your own investment objectives, please reach out to your portfolio manager.
Robert Sanders is Senior Vice President and Portfolio Manager at Woodstock Corporation.
You may contact him at rsanders@woodstockcorp.com.
[1] Woodstock Corporation, Quarterly Newsletter, Summer 2018.
[2] FactSet Research Systems Inc.
[3] American Association of Individual Investors (AAII) Asset Allocation Survey, September 2018.
[4] Gallup investor survey, April 2018.
[5] TradingEconomics.com, U.S. Bureau of Economic Analysis.
[6] U.S. Bureau of Labor Statistics.
[7] Jerome H. Powell, “Monetary policy and risk management at a time of low inflation and low unemployment, Oct. 2, 2018.
[8] Yardeni Research, U.S. Bureau of Labor Statistics.
[9] International Monetary Fund (IMF), World Economic Outlook, Oct. 9, 2018.
[10] Morningstar.com, “2018 Fundamentals for Investors”.
